
Last updated October 16, 2026
Death Rates by Mountain: Which Peaks Are Really Deadliest?
Annapurna leads a comparable Nepal 8,000-metre death-to-summit table. Everest has the highest recorded death toll. K2 belongs in the conversation—but uses a different dataset. See the numbers, understand the denominators, and discover what the statistics can—and cannot—tell you.
By Global Summit Guide · 2026 edition · Nepal comparison: Himalayan Database public report (1905–2025). Mountain deaths are not a predictor of individual odds.
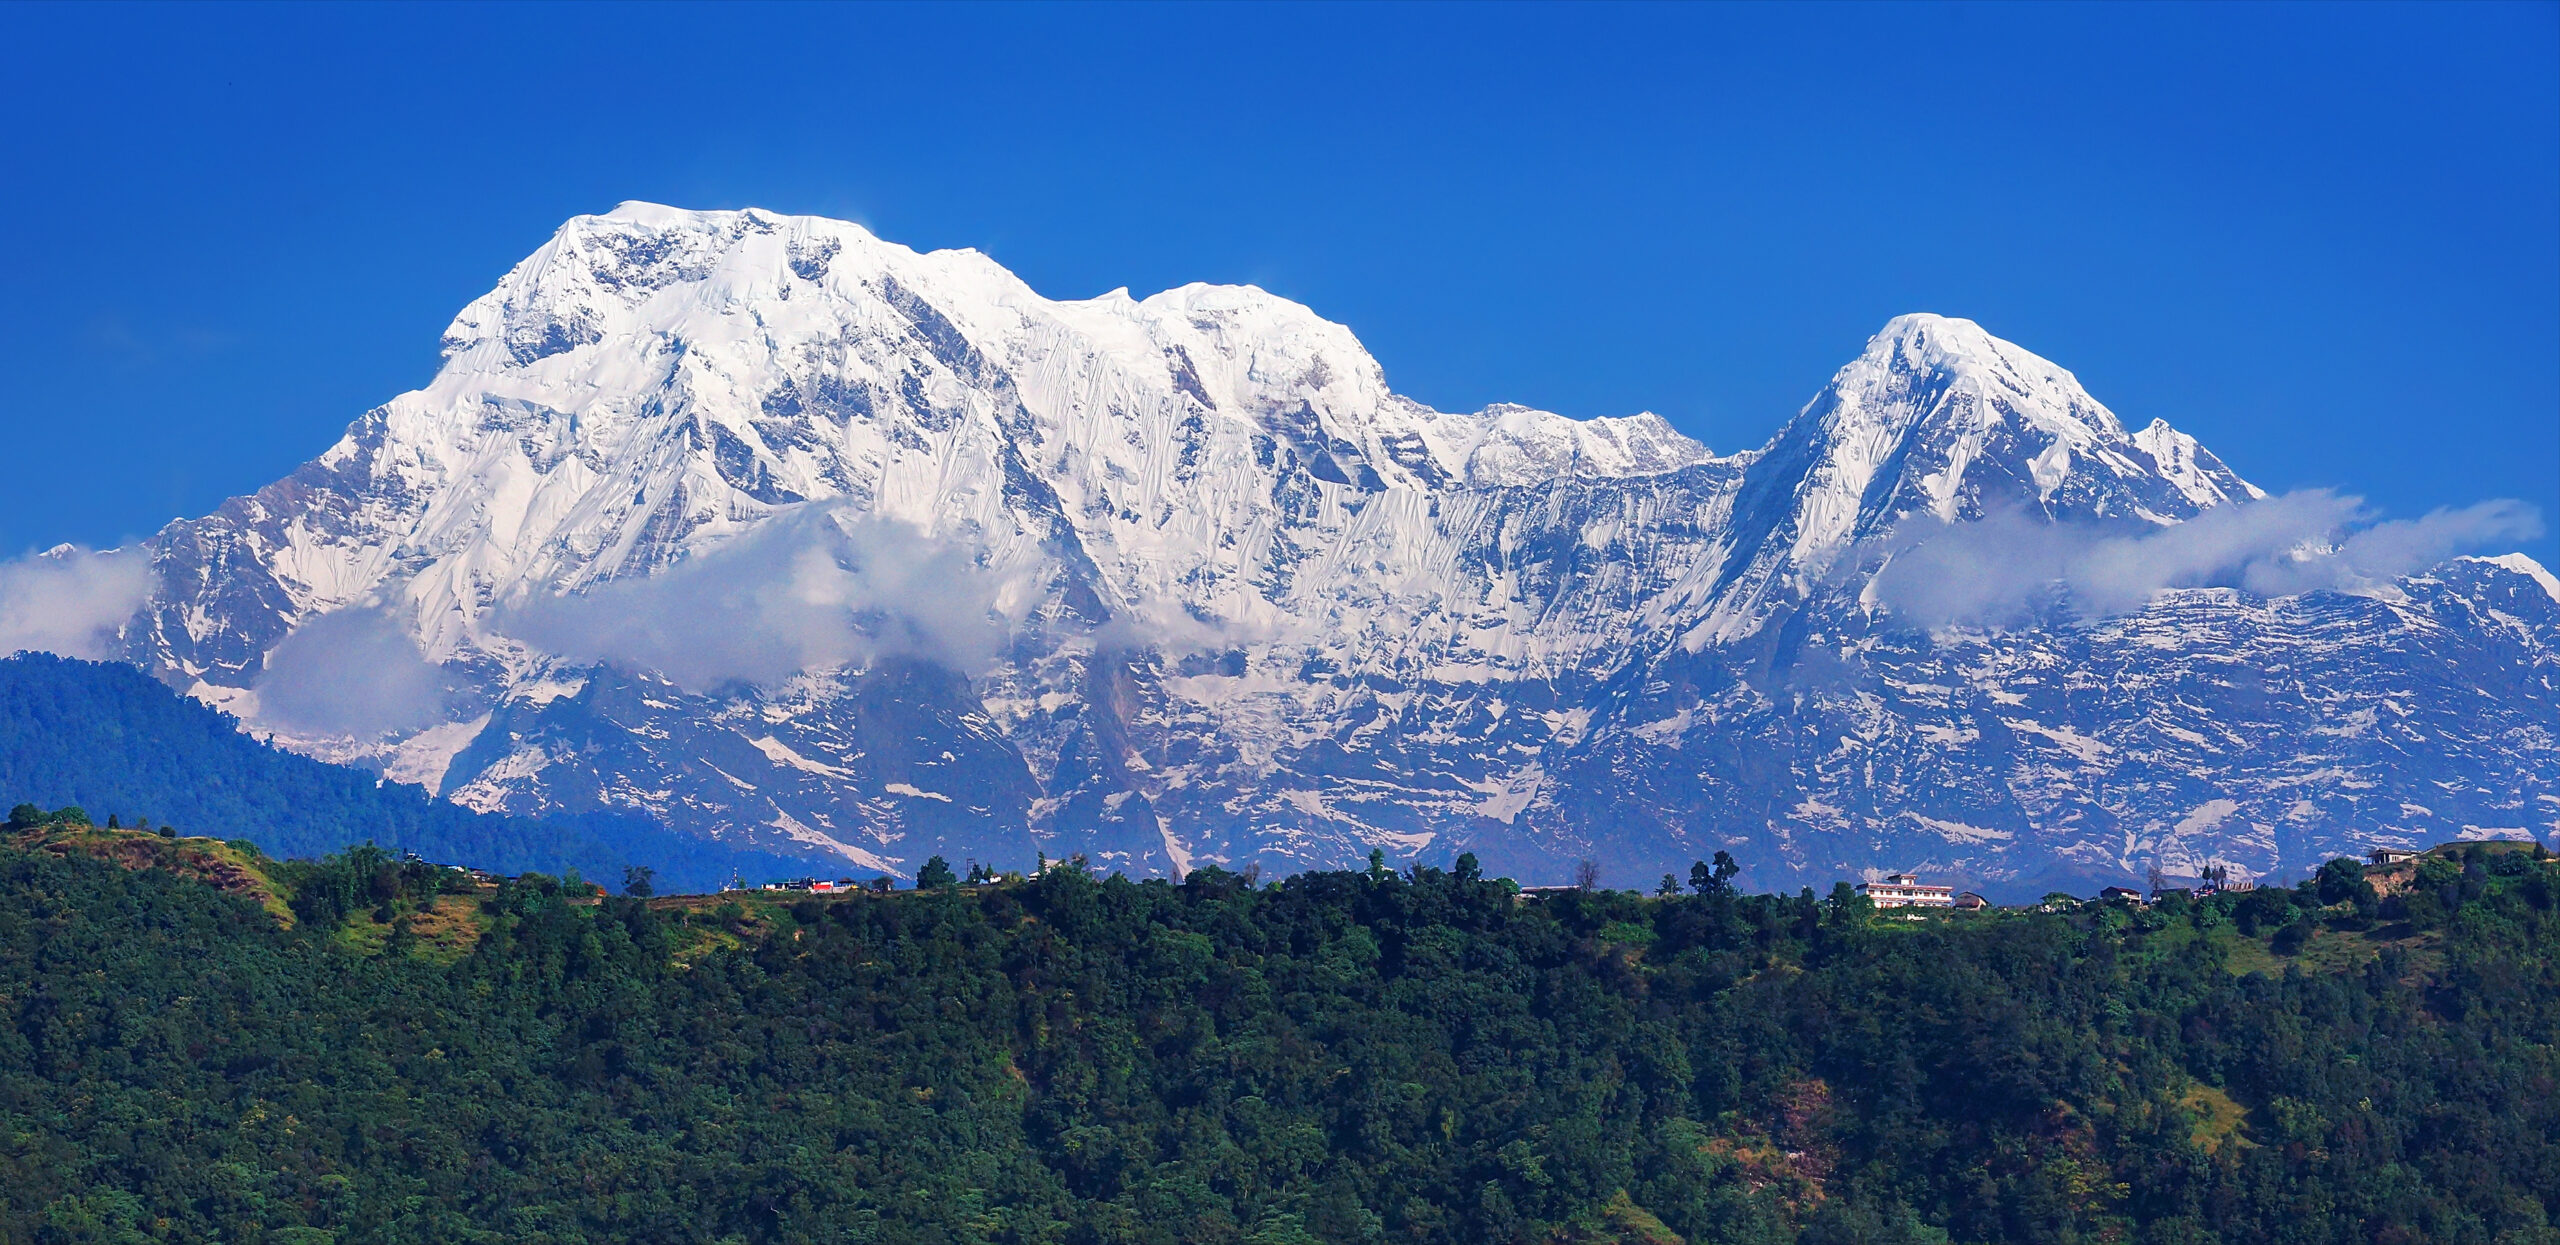
Which mountain has the highest death rate?
The honest answer depends on whether you compare deaths with summits, member records, or total recorded fatalities.
Among the eight principal Nepal 8,000-metre peaks in the Himalayan Database, Annapurna I leads deaths divided by successful summits: 75 deaths / 557 summits = 13.46%. Dhaulagiri I is close at 13.03% (92 / 706). Everest has the largest recorded fatality total: 344 deaths, but its deaths-to-summits ratio is 2.54%. These are historical ratios—not the chance that one climber will die on a future expedition.
Beyond Nepal: Pakistan’s K2 and Nanga Parbat are not in the Himalayan Database’s Nepal expedition comparison. Their published statistics must be labeled with a separate source and cutoff. Never silently fold them into the same-system ranking.
Data: Himalayan Database, Most Dangerous Peaks. Current public report covers expeditions through 2025; figures may be revised after later releases.
One phrase. Four different measures.
A headline that says “death rate” without telling you what is being divided is not enough to compare mountain risk.
Deaths ÷ successful summits
The widely quoted Annapurna and K2 headline metric. It compares recorded fatalities with successful summit events. Summits do not include every failed attempt, turnaround, or exposed climber; the numerator and denominator are not opposite outcomes from a single cohort.
Example: 75 ÷ 557 × 100 = 13.46%.Deaths ÷ expedition members
Himalayan Database member records capture a broader population than summits. This ratio is useful alongside deaths/summits, but members have different responsibilities and may appear in different seasons. It is not individualized one-trip risk.
Example: Annapurna 75 ÷ 2,059 × 100 = 3.64%.Total recorded deaths
Everest leads this measure in the Himalayan Database because its climbing history is long and modern participation volume is high. A large absolute death count does not by itself indicate the highest danger per expedition.
Example: Everest: 344 cumulative recorded deaths.Era, route and team-specific risk
What matters for a climb today includes the route, season, equipment, team composition, support, weather, rescue margin and hazards above the planned camps. Public cumulative mountain ratios alone cannot calculate this.
Compare like-for-like periods and clear exposure populations whenever possible.Consider two climbers who turn around safely before a summit attempt and one climber who summits twice in different years. All three appear differently in historical summit and member records. Add expeditions with hired high-altitude staff, unresolved summit claims, and mid-season rescue events, and it becomes clear why the label above a percentage matters as much as the percentage itself. For a broader look at evidence quality, visit the Mountaineering Truth Project.
Nepal Eight-Thousanders: Ranked on the Same Basis
Eight named summit rows, one data system, the same cumulative report. Ranked here by deaths per recorded successful summit—not by an invented personal survival estimate.
| Mountain | Deaths | Summits | Members | Deaths / summits | Deaths / members |
|---|---|---|---|---|---|
| Annapurna I | 75 | 557 | 2,059 | 13.46% | 3.64% |
| Dhaulagiri I | 92 | 706 | 2,999 | 13.03% | 3.07% |
| Kangchenjunga | 54 | 682 | 1,749 | 7.92% | 3.09% |
| Makalu | 51 | 886 | 2,898 | 5.76% | 1.76% |
| Manaslu | 90 | 3,238 | 7,085 | 2.78% | 1.27% |
| Everest | 344 | 13,550 | 26,316 | 2.54% | 1.31% |
| Lhotse | 25 | 1,465 | 3,477 | 1.71% | 0.72% |
| Cho Oyu | 52 | 4,056 | 9,208 | 1.28% | 0.56% |
Reading the columns: Member records include different expedition roles and repeated participation over time. Figures reflect the Himalayan Database public report (expeditions through 2025). Compare the original peak table and check the deaths-per-summit definitions. K2, Broad Peak, Gasherbrum I/II and Nanga Parbat are outside this Nepal-specific table.
Eight mountains, one historical ratio.
The bar length is deaths per 100 successful summit records; it does not represent a climber’s chance of dying. Annapurna is the reference maximum in this particular table.
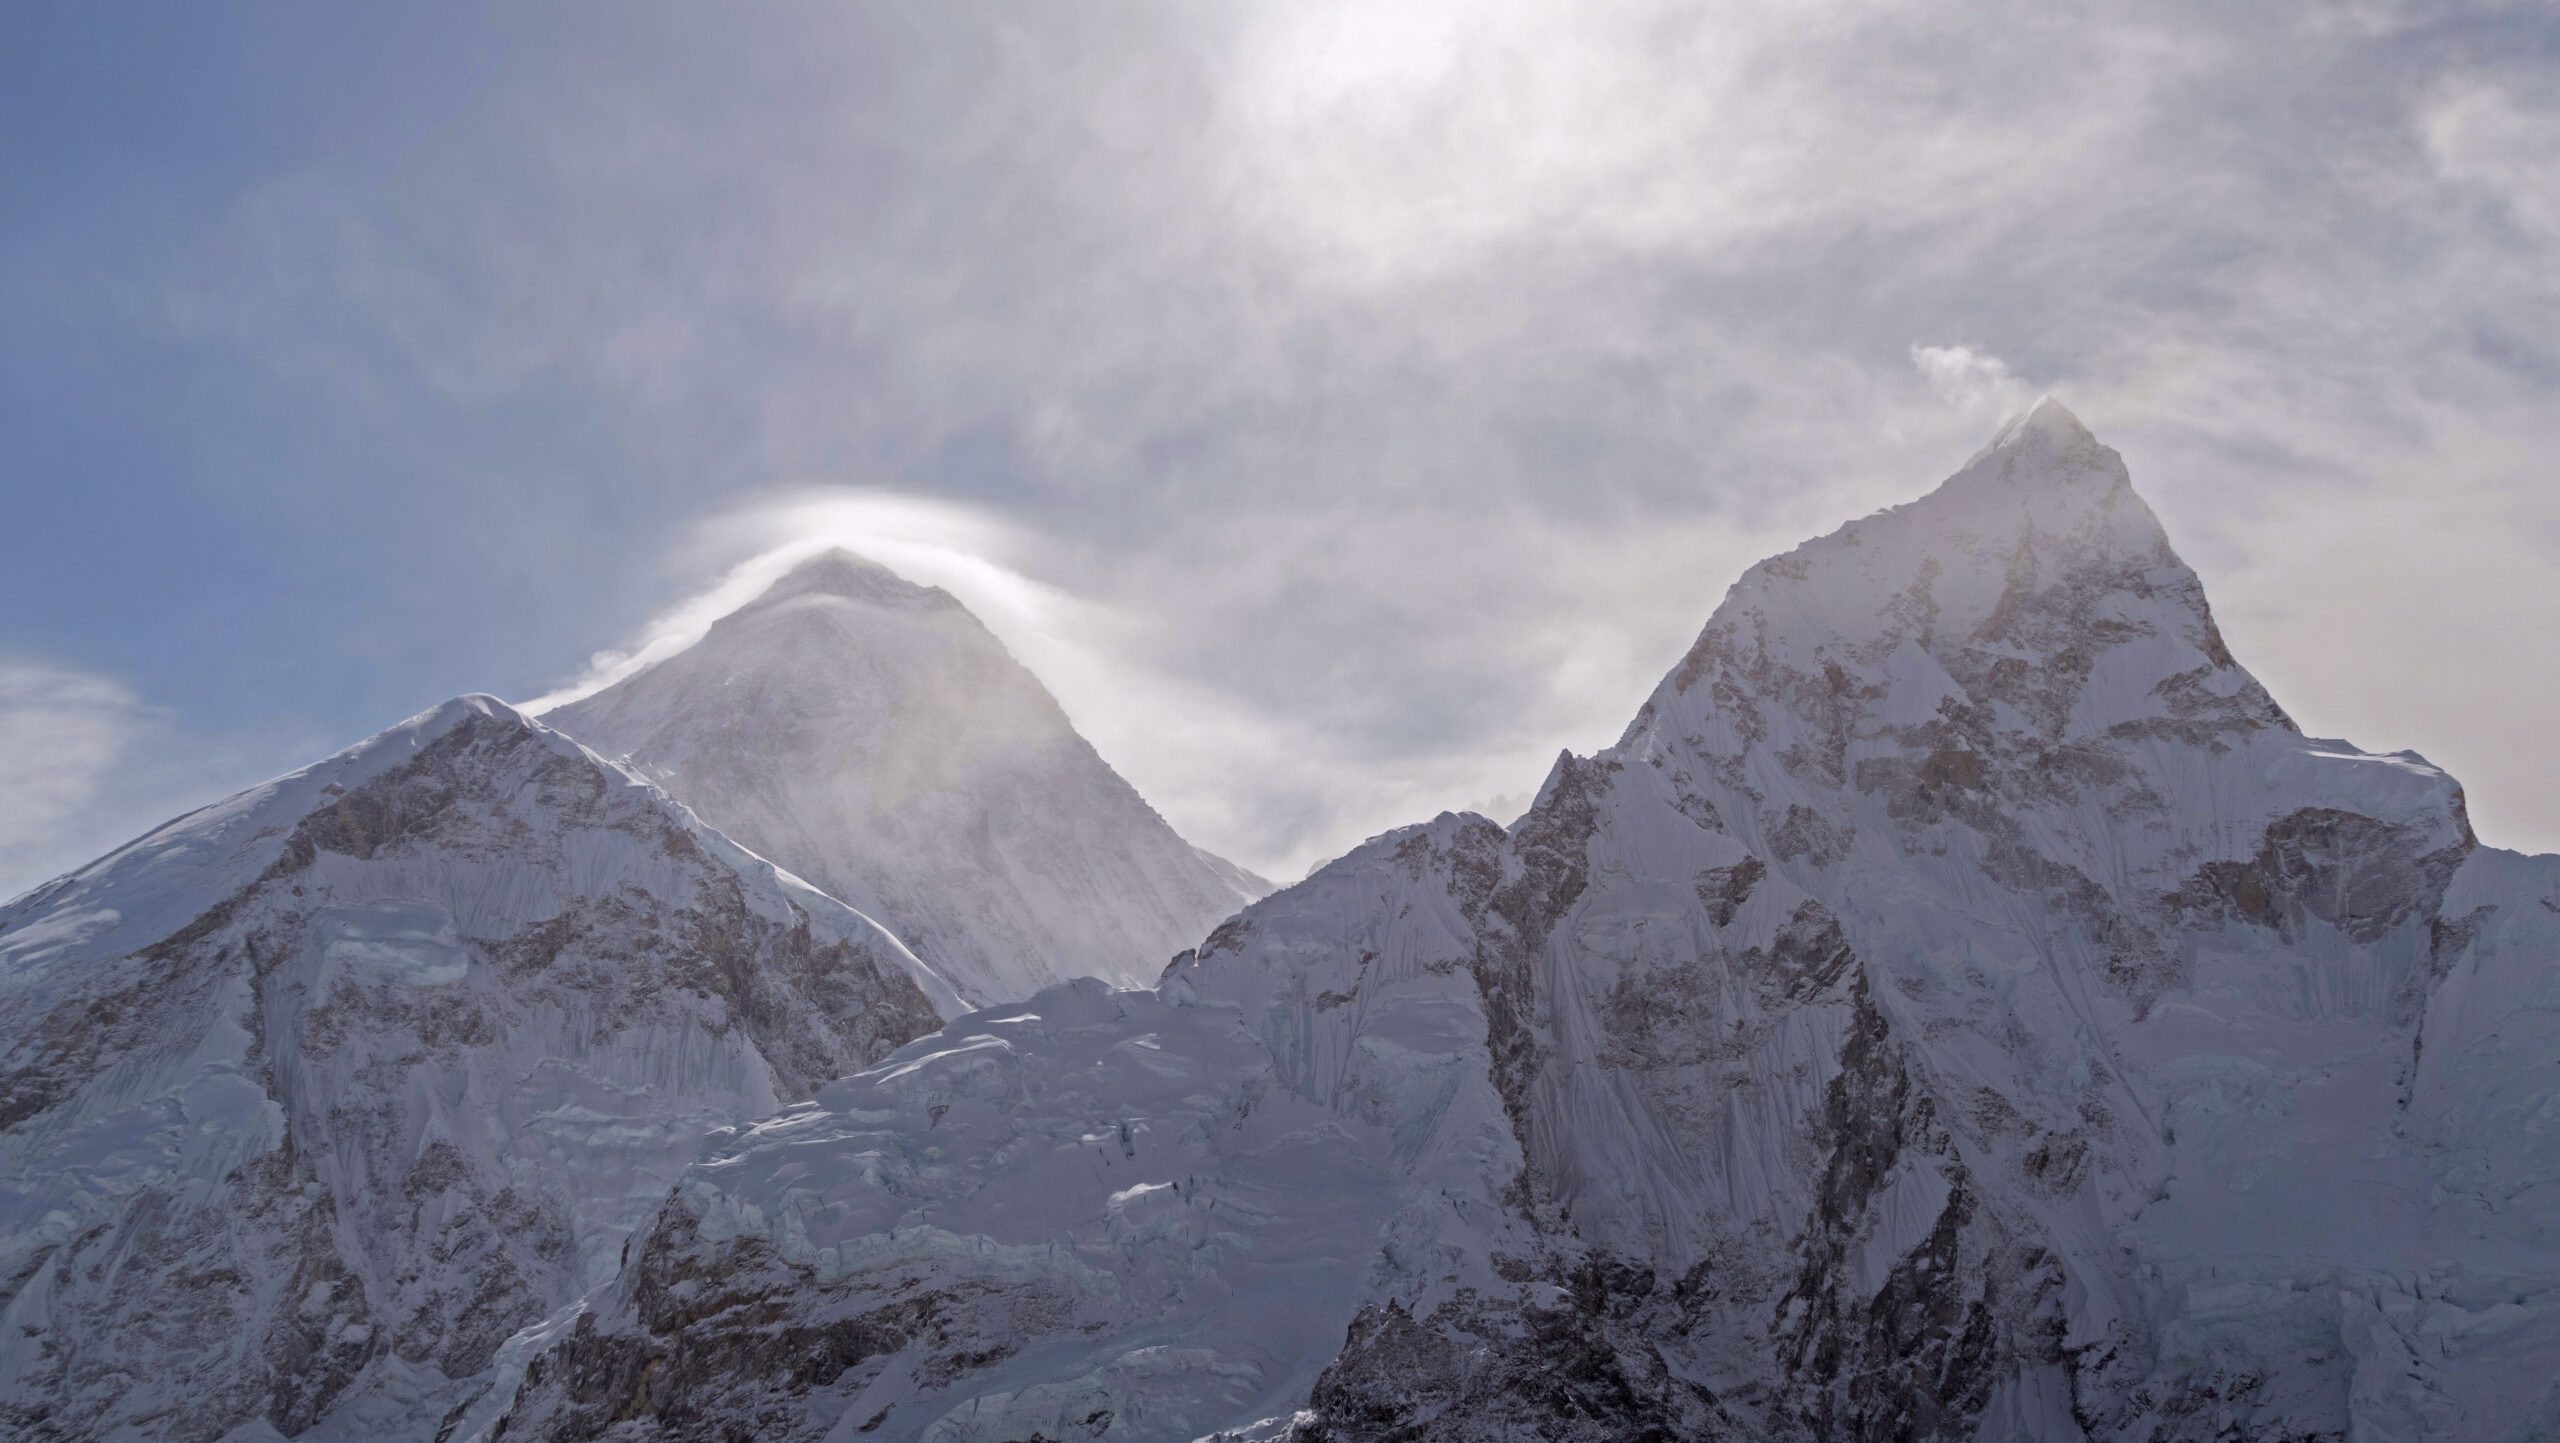
Everest is the statistical outlier.
The Himalayan Database lists 13,550 summit records for Everest and 344 deaths. The cumulative deaths-to-summits ratio is 2.54%, far below Annapurna’s 13.46%—yet the absolute toll is far greater.
For a different question, switch attention to deaths per expedition member: Everest’s figure is 1.31%, while Annapurna’s is 3.64%. This is still an aggregate historical rate, not a forecast for a Nepal-side guided Everest ascent, a Tibet-side route, or an independent team.
Six mountains that change the meaning of danger.
A statistic becomes more useful when the terrain, season, rescue realities, and historical exposure behind it are also described.
Annapurna I
Its high ratio reflects a long history of serious avalanche and serac exposure, limited safe passage options and the complexity of high-altitude retreat. The famous older “one in three” shorthand is no longer a current cumulative figure.
Read the Annapurna data →
Dhaulagiri I
Almost level with Annapurna on the same metric. Complex weather, avalanche exposure and demanding high-altitude terrain make the statistical comparison more than a ranking of famous names.
Explore the Dhaulagiri guide →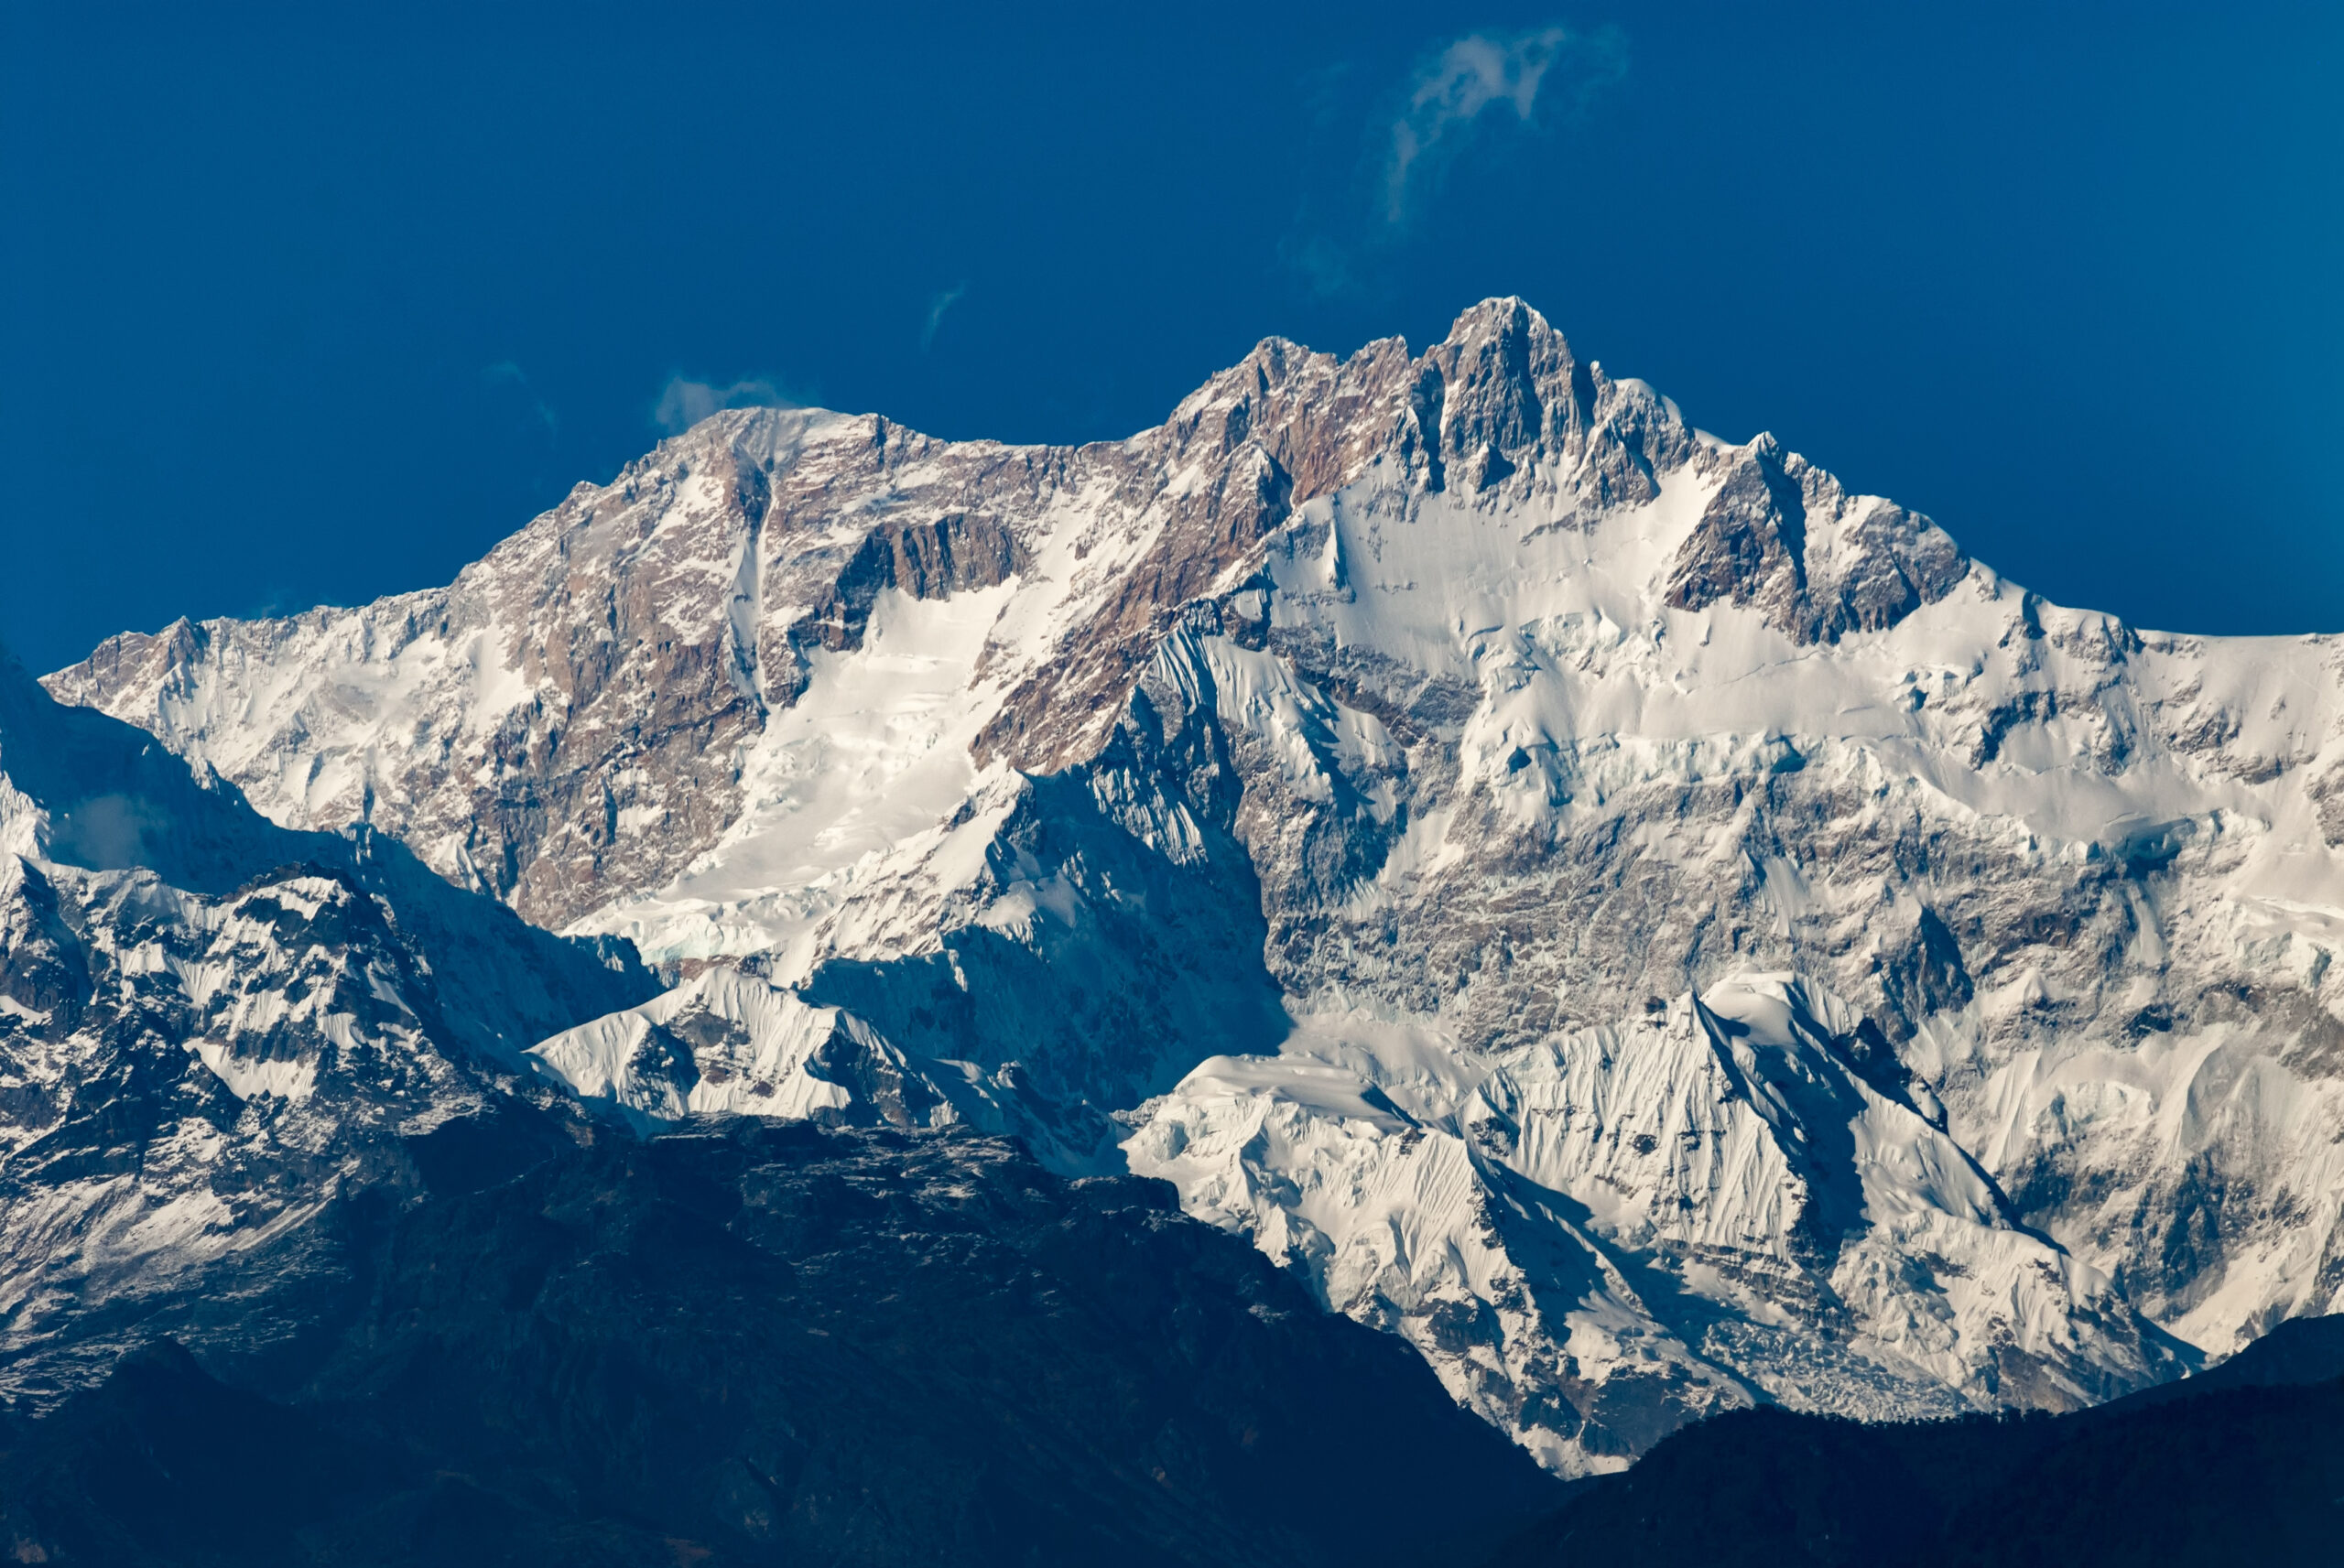
Kangchenjunga
Remoteness, long routes, extreme altitude and narrow weather windows shape the record. Its 3.09% deaths-per-member ratio is also high among the eight principal Nepal peaks.
Explore Kangchenjunga →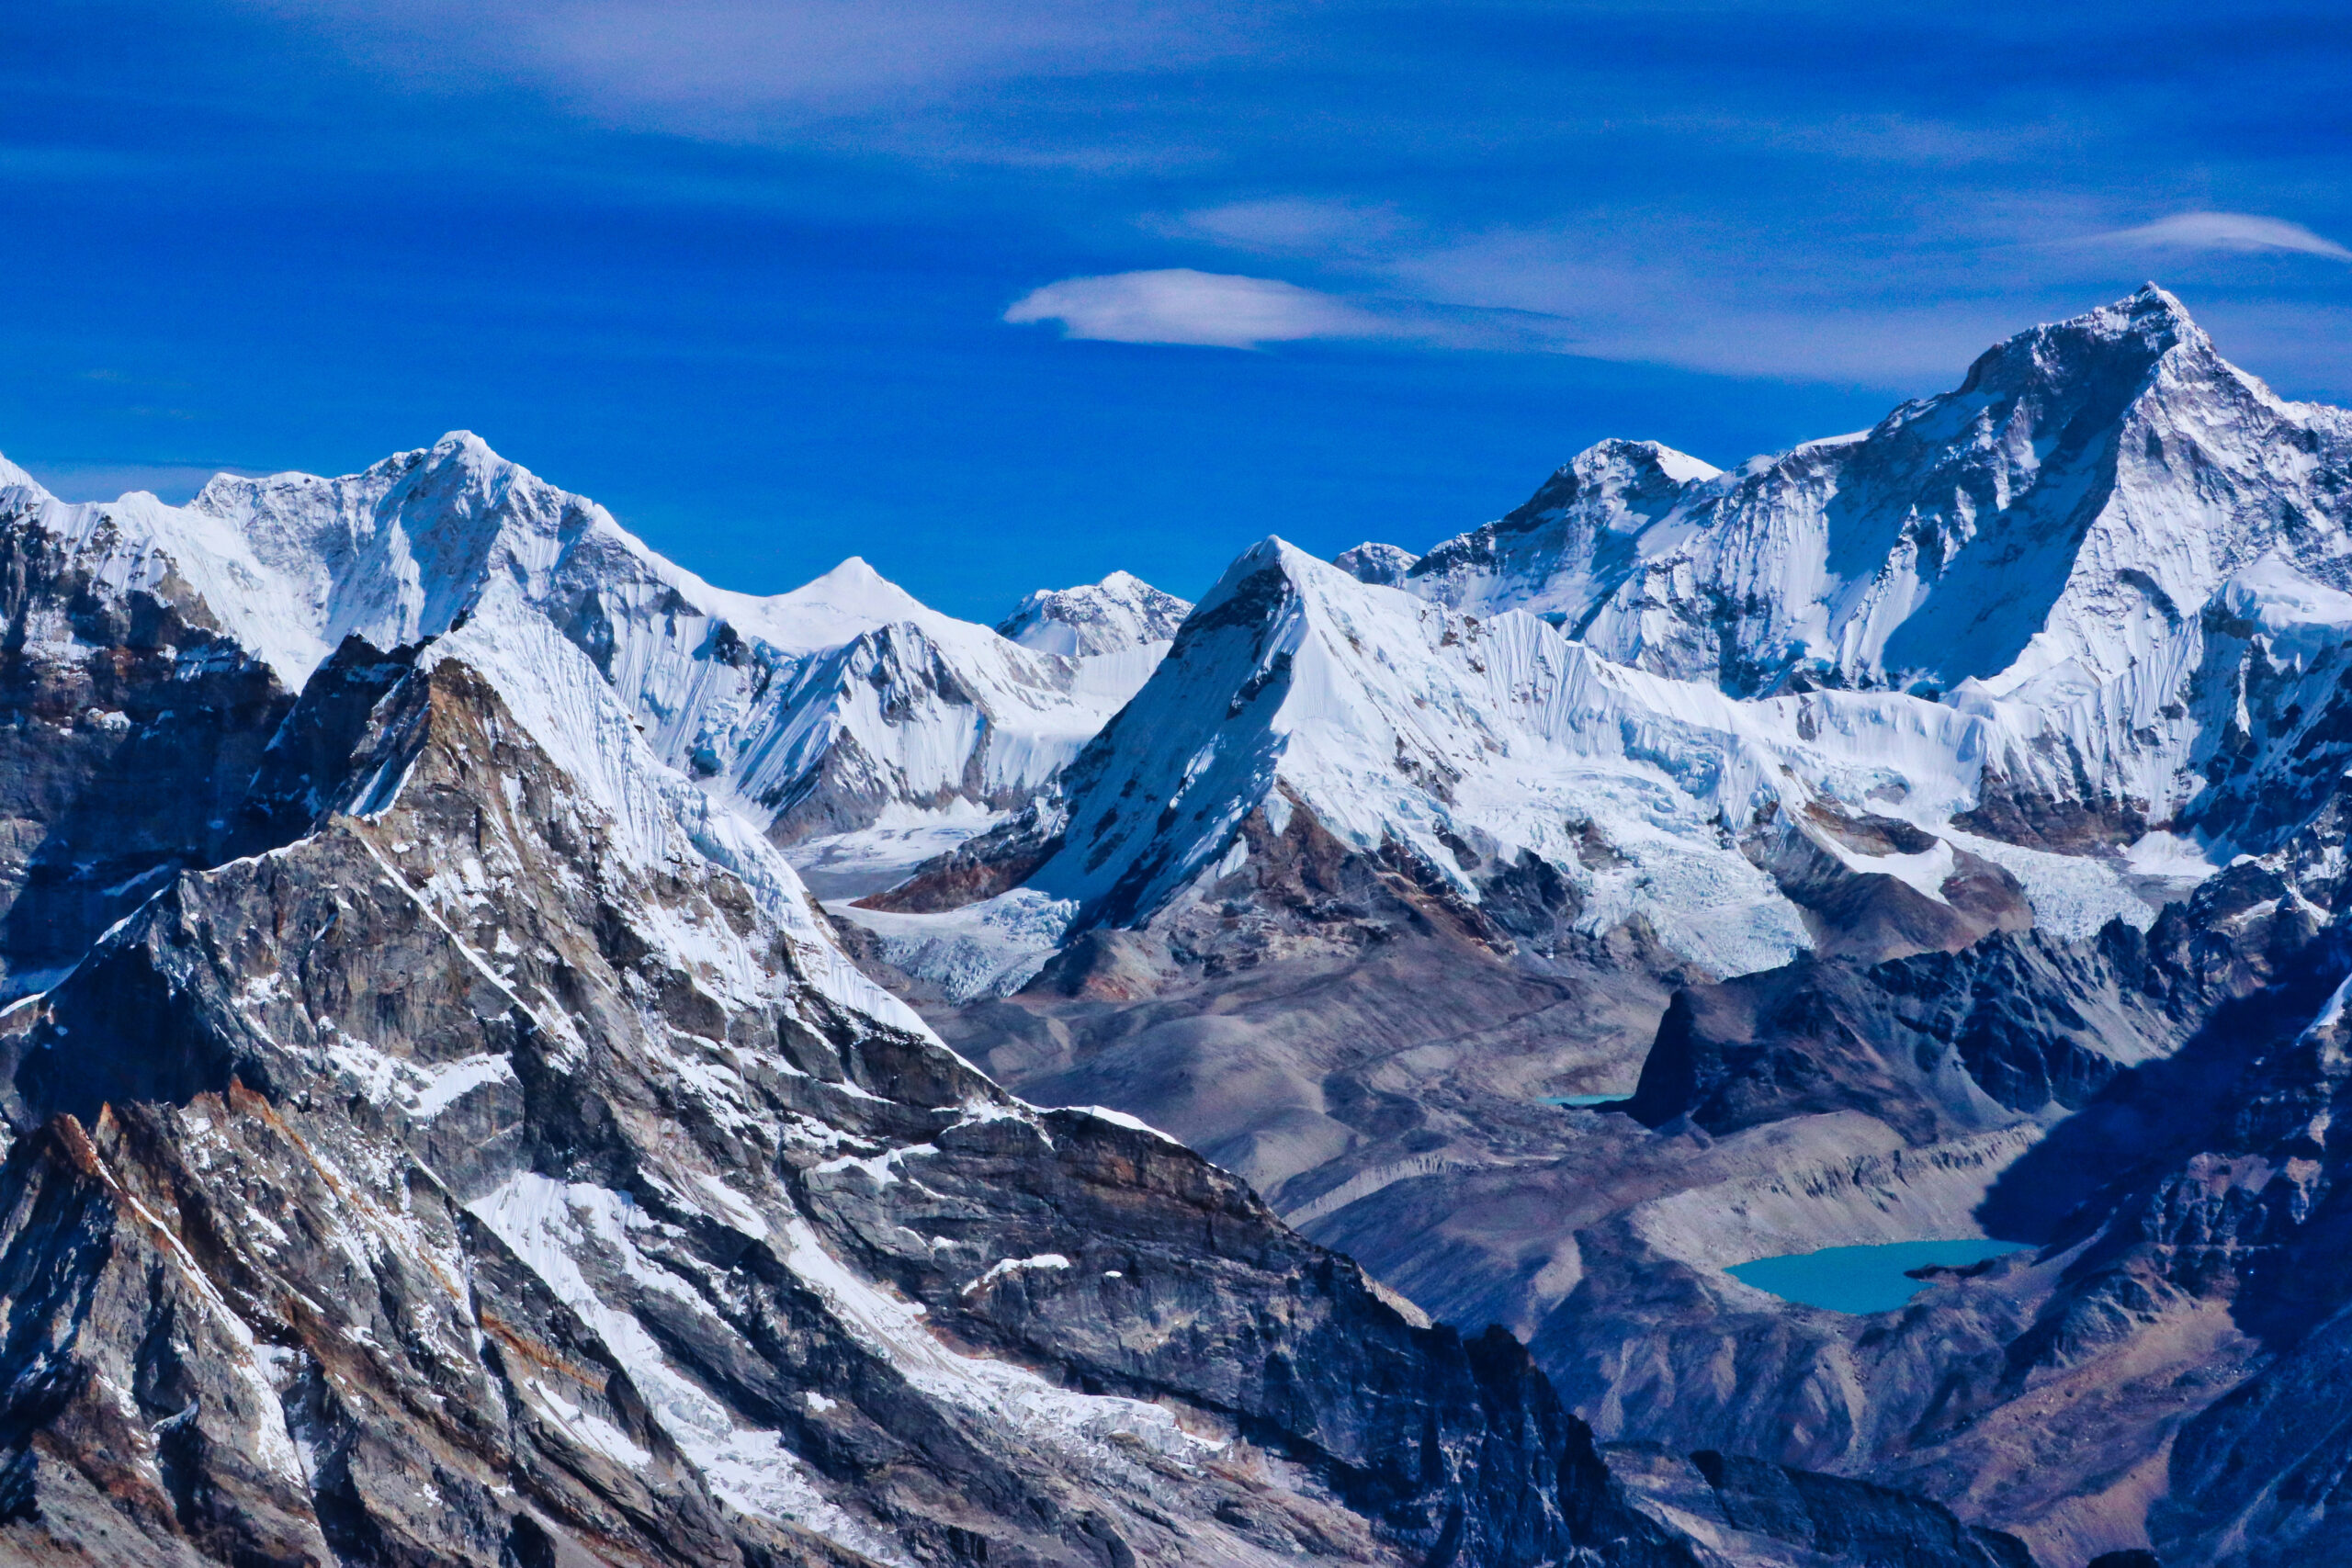
Makalu
The steep summit pyramid, exposed snow and ice and difficult descent add serious complexity above 8,000 metres. Look beyond the single number for the risk profile of a particular route.
Review Makalu fatality data →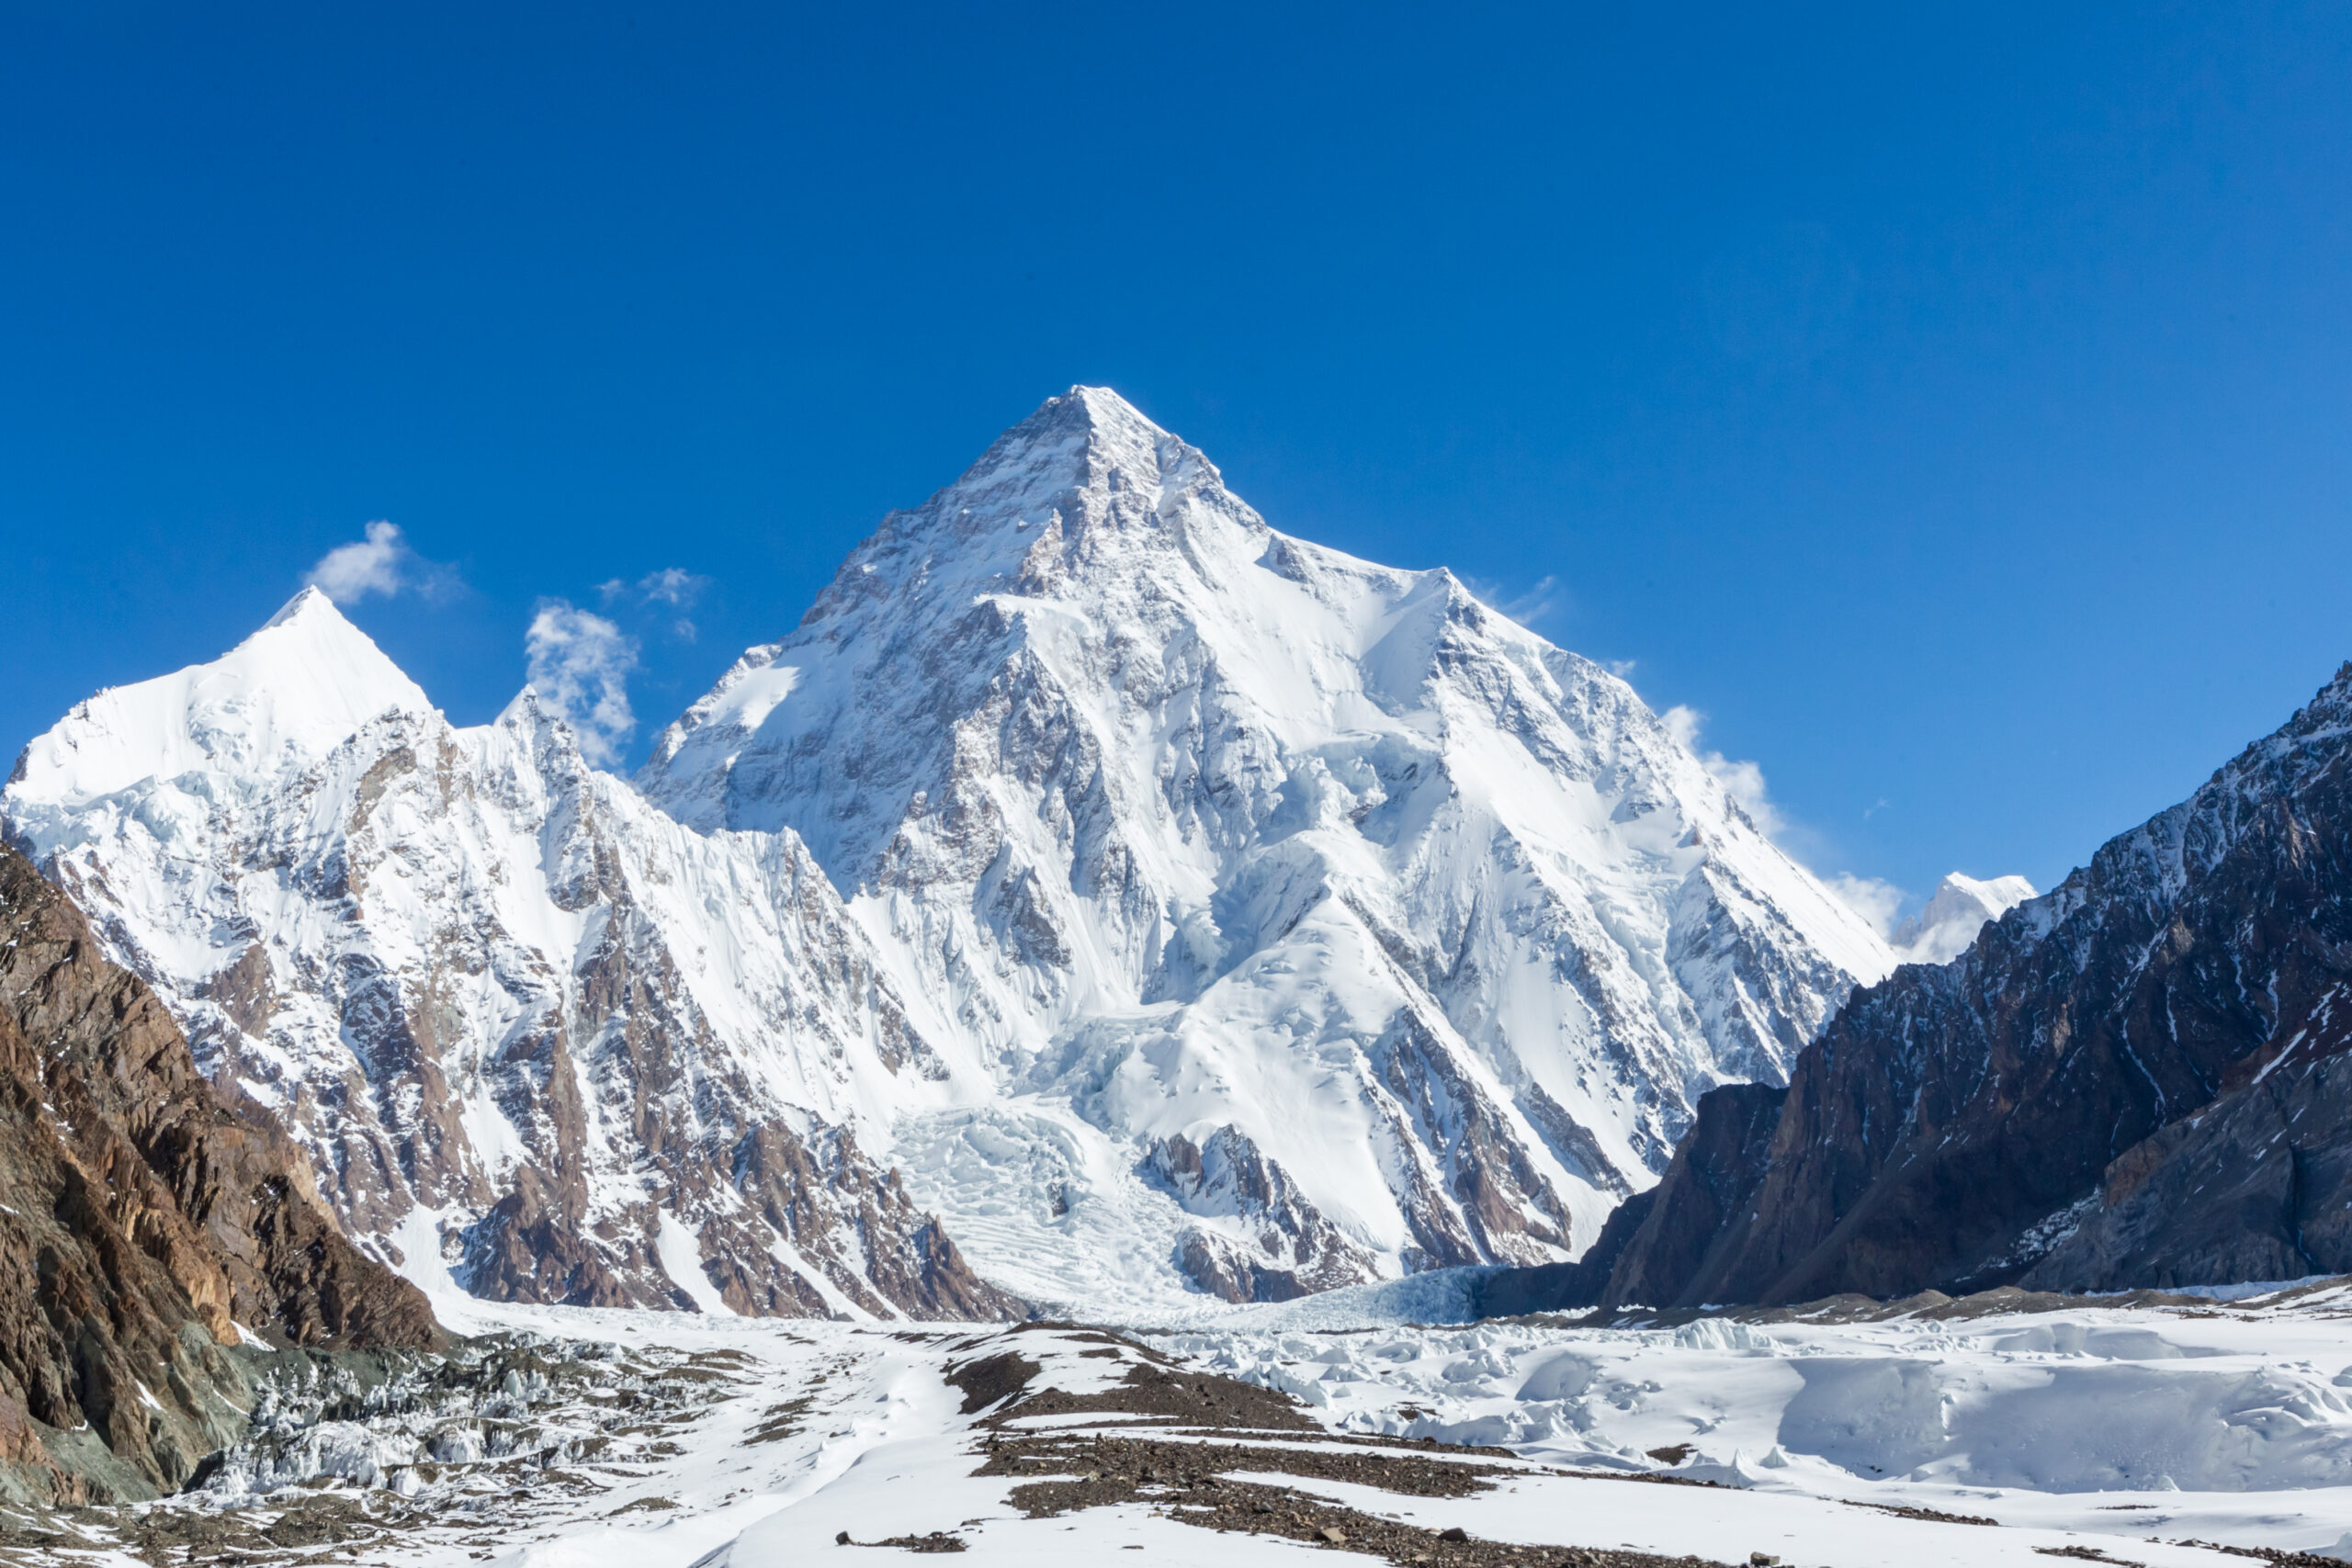
K2
Extreme steepness, exposure beneath the Bottleneck serac, weather and technical descent make K2 a defining example of danger that no single historical percentage captures. Do not treat its source series as a row in the Nepal comparison.
Read the K2 method and data →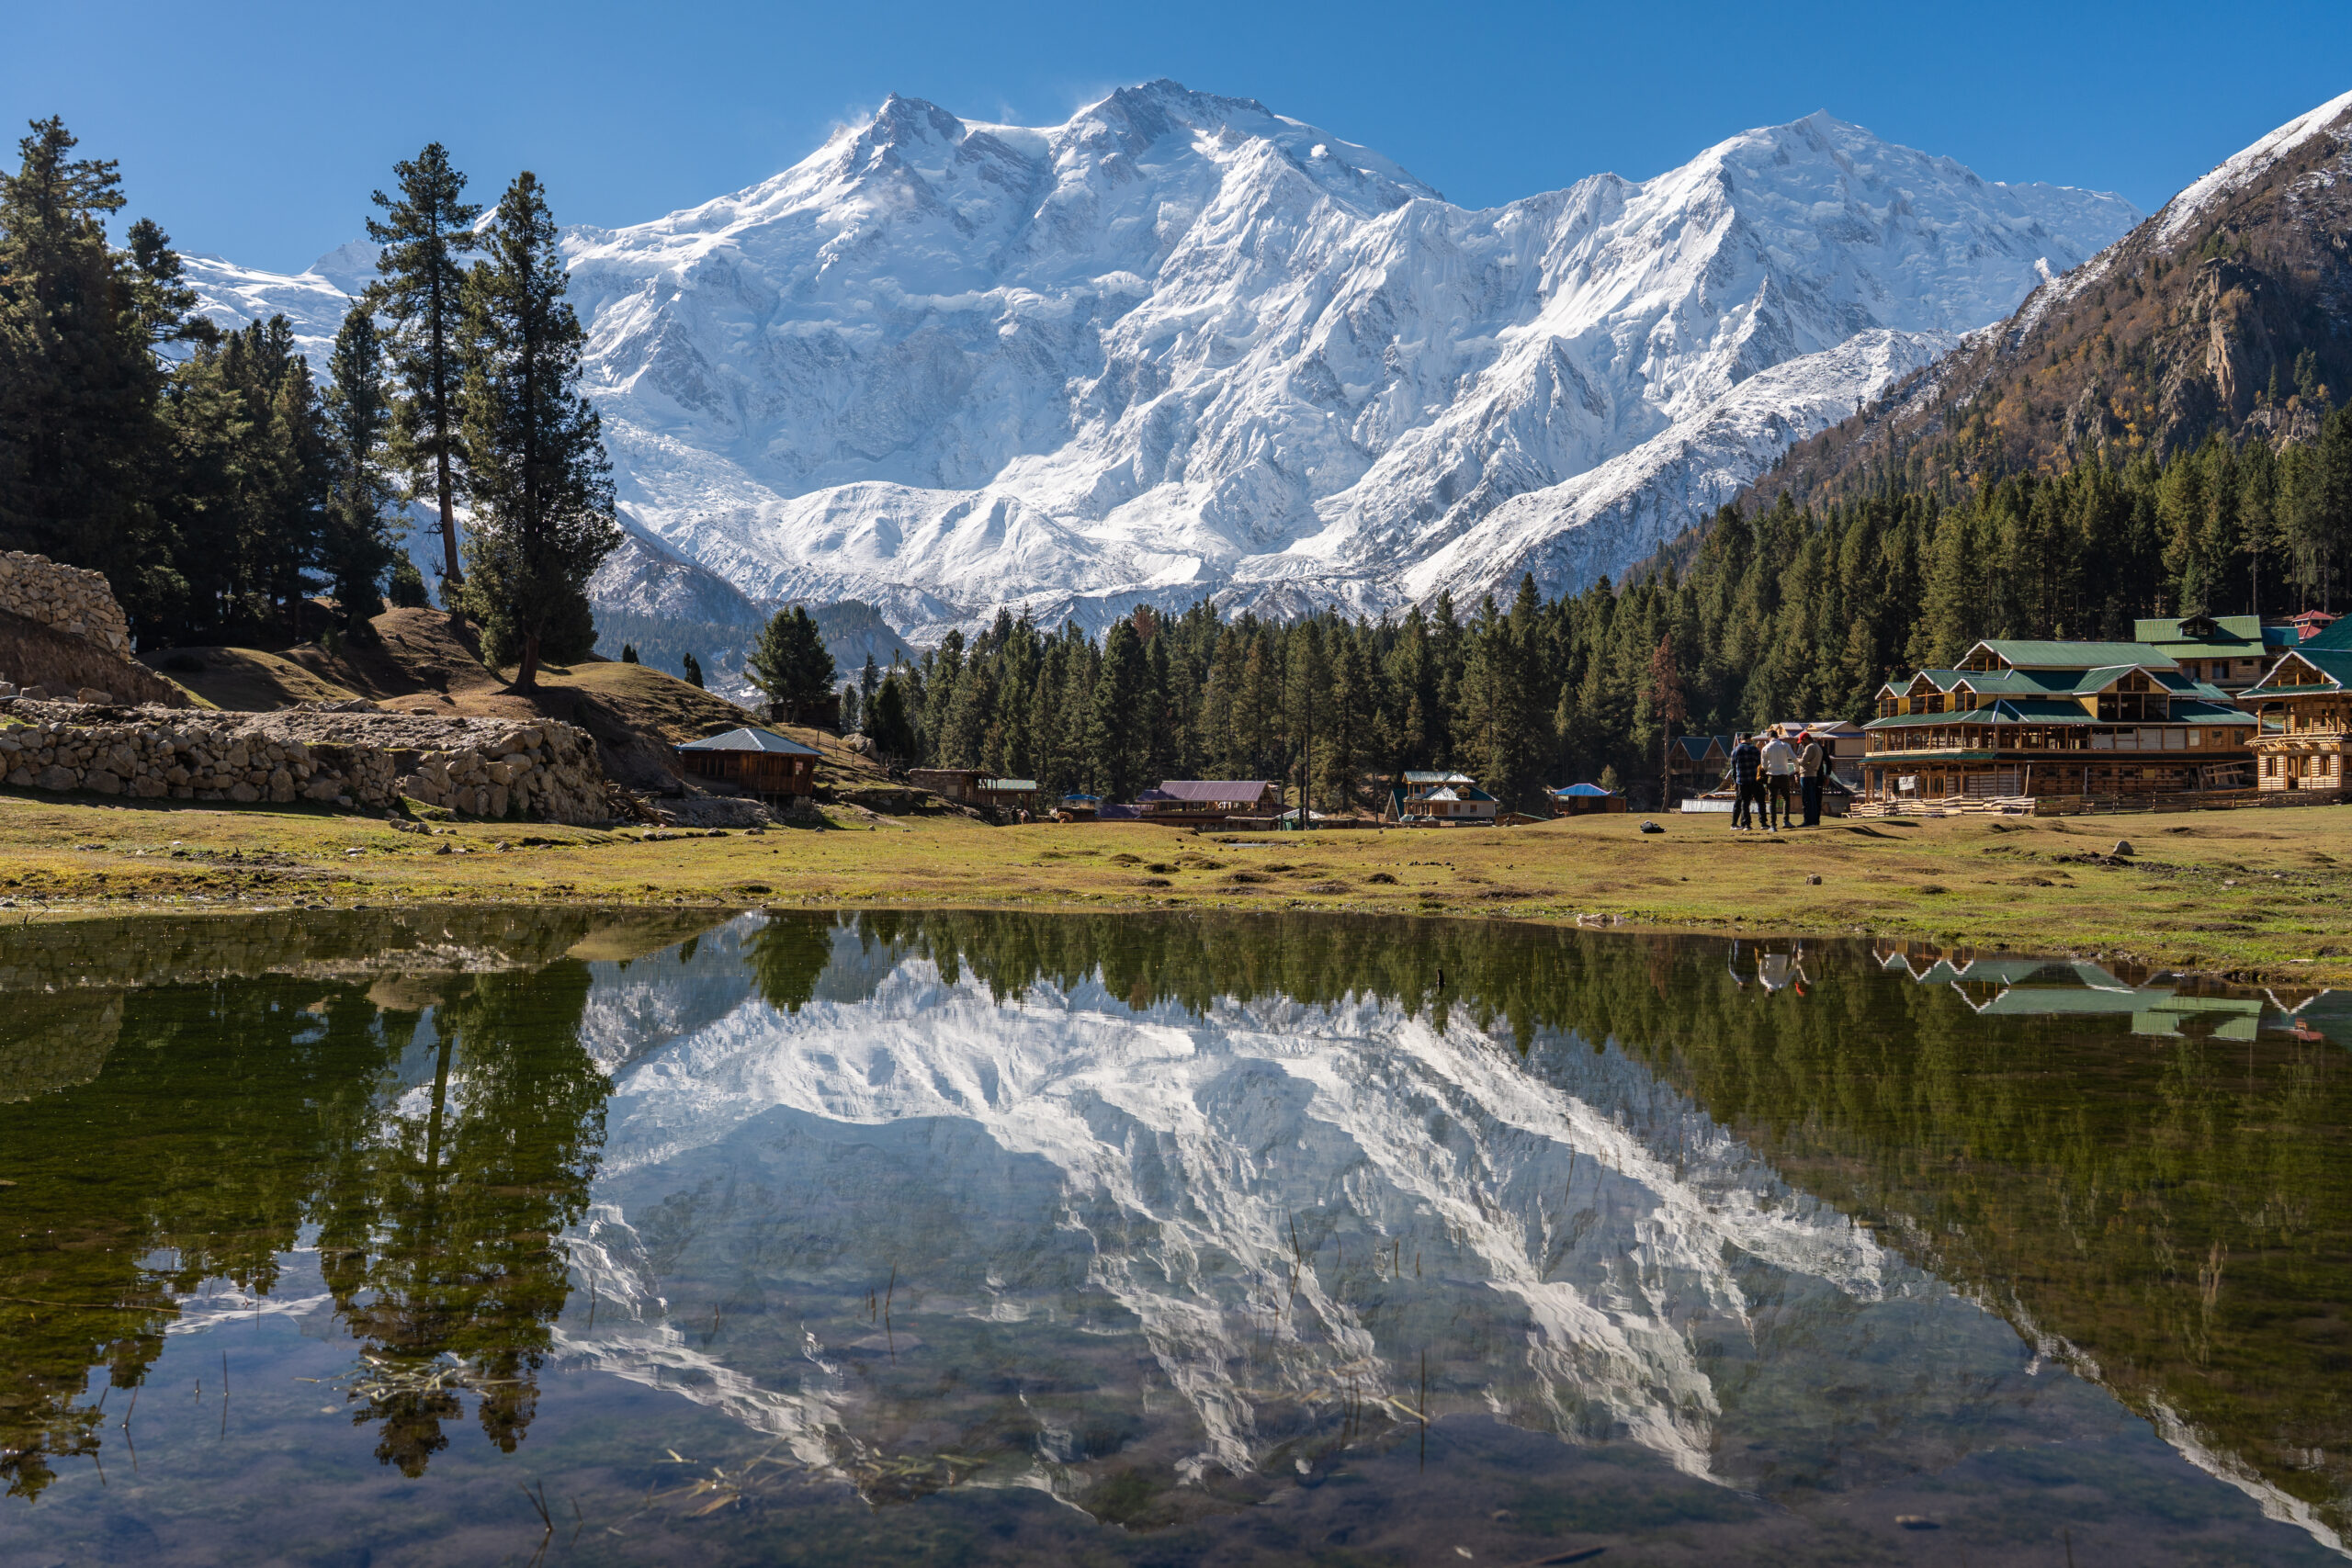
Nanga Parbat
Its vast faces, avalanche history and difficult access demand route-specific research. Historical figures are commonly repeated from different cutoffs; a reliable comparison needs a known denominator and period.
Read the Nanga Parbat record →Mountain photographs depict the specific named peaks. The six profiles are editorial examples of distinct hazards, not a second numerical ranking. Read the linked peak guides for the appropriate source dates and route-specific context.
The old percentages did not necessarily become false. They became old.
Long-term denominators can grow faster than death counts as more teams reach the summit. An unchanged old headline then misrepresents the current cumulative record.
~27–32% → 13.46%
Earlier publications used far fewer successful ascent records. Guinness’ January 2018 record headlined 27.6%, while its explanatory text listed 69 deaths and 261 ascents; these displayed counts do not reproduce exactly 27.6% if divided directly. The current Himalayan Database report uses 75 deaths / 557 summits. The mountain’s hazards did not disappear.
~22–25% → separate modern calculation
Older K2 summit histories are widely recycled without their cutoff year. More modern successful summit records change the ratio, but the Pakistan-side data still require their own documented source and definitions.
Smaller ratio ≠ safe mountain
Better weather forecasts, stronger fixed-line systems and improving logistics can change outcomes. But a fatal avalanche or storm can still occur during a single season even when the cumulative ratio is falling.
For a modern climber, read the latest event reports alongside the cumulative record. The K2 disaster archive and Everest disaster histories show why rare, high-impact events can dominate a mountain’s reputation.
How do mountains actually kill climbers?
Different physical mechanisms require different preventive choices. Technical skill, weather selection and team systems matter more than an attractive number on a chart.
Avalanche & serac collapse
Snow slabs, unstable hanging ice and exposure beneath seracs can create sudden, objective danger that expertise cannot remove. Exposure minimization and route/timing choices matter.
Falls & technical errors
Steep rock, ice, fixed ropes and fatigue turn small mistakes into severe outcomes. Technical proficiency, protection systems, judgment and an efficient descent are essential.
Storms & extreme cold
Wind, poor visibility and deteriorating weather compress return windows. A route can be manageable in stable conditions and untenable once the descent is delayed.
Extreme-altitude illness
Hypoxia above 8,000 metres reduces physical performance and judgment. Acclimatization, oxygen planning where applicable and appropriate medical decisions affect the expedition. Build the timing decision using the summit-weather-window guide.
Exhaustion & time loss
Slow movement, queueing, unexpected route work and summit fixation can consume the safety margin needed to get down. A summit is only halfway through the climbing task.
Rescue & communication limits
A rescue on a remote Himalayan face is not equivalent to evacuation near a road. Weather, altitude, aircraft capabilities and team communication can make outside assistance unavailable.
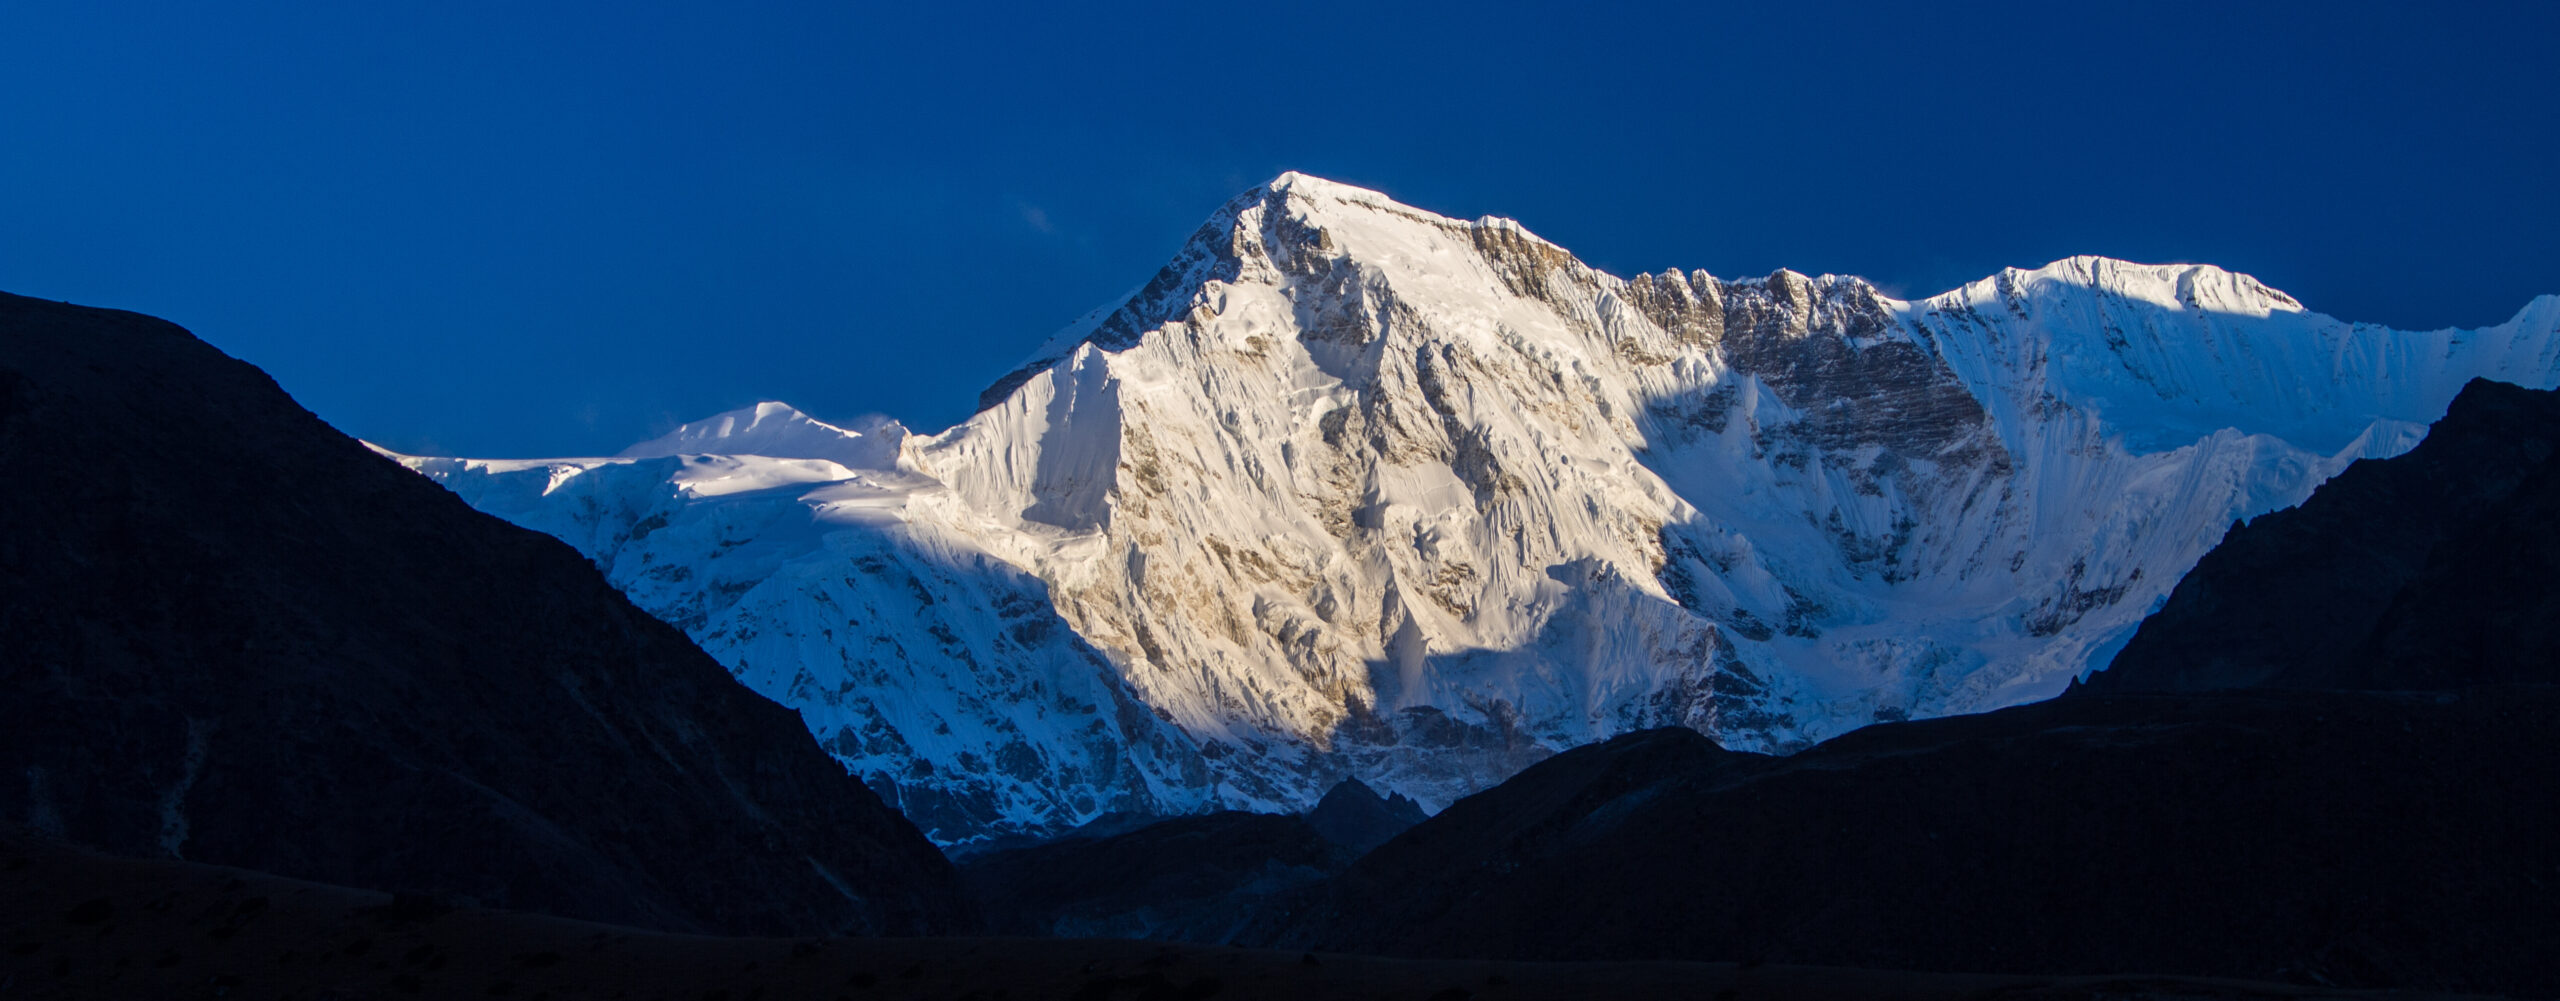
Cho Oyu is the bottom of this table—not a beginner peak.
Cho Oyu’s 1.28% deaths-to-summits ratio is the lowest among the eight principal Nepal 8,000-metre summit rows here. That figure still describes a high-altitude mountain requiring specialist systems and a clear expedition plan.
The right planning question is not simply “Which number is lowest?” It is whether the specific route, climate, expedition model, experience and retreat plan suit the team.
Read the complete Cho Oyu risk analysis →K2 and Nanga Parbat need their own evidence standard.
Both are major 8,000-metre peaks in Pakistan. Neither belongs inside the Himalayan Database’s Nepal-only series as though the recording methodology were identical.
K2: what the separate history says
Global Summit Guide’s K2 fatality analysis maintains a separate closed-through-2025 compilation of 92 recorded deaths and 964 successful summits, equal to 9.54 deaths per 100 summits. Treat that as a GSG-compiled historical reference, not an officially matched HDB row and not an estimate of present-day individual attempt mortality.
The Bottleneck’s ice hazard, steep terrain and demanding descent mean no competent evaluation reduces K2 to a simple number. Its famous “one in four” claim is from an earlier cumulative era; using it as an undated current rate is misleading.
GSG-compiled K2 ratio
92 recorded deaths / 964 successful summits · records closed through 2025.
Not a directly comparable row of the Nepal HDB table and not personal odds.
Four questions before quoting a rate
- Which expeditions were counted?
- What year ends the series?
- Are support staff and repeats included?
- Is the denominator summits, climbers or attempted ascents?
Nanga Parbat: resist the recycled statistic.
The mountain has a long and tragic history, including fatal expeditions before its 1953 first ascent, exposure on vast mountain faces, and repeated avalanche disasters. Older percentages circulate widely with different time periods and climbing populations.
Rather than invent a directly comparable number for this table, the responsible approach is to review Nanga Parbat’s peak-specific mortality guide and check the historical numerator, denominator and cutoff together. A “world ranking” that fails to disclose those differences rewards unreliable arithmetic.
The most deaths can coexist with a lower ratio.
High participation volume creates more recorded exposure. That is why the cumulative fatalities column and a ratio column tell different stories.
Everest’s 344 deaths are the largest absolute total in the Himalayan Database report. Its 13,550 successful summit records make the deaths-to-summits ratio 2.54%. Annapurna’s 75 deaths and 557 summits produce 13.46%, with a much smaller summit volume.
More deaths across a larger historical activity base do not automatically mean that Everest is less difficult or more dangerous in every possible context. The normal routes on Everest have different commercial infrastructure and support patterns than infrequently climbed technical faces elsewhere.
Nor do these figures support statements such as “Everest has a 97.46% survival rate.” Failed summit bids, climber repeats, high-altitude workers, accidents below base camp and different eras are not represented by a clean 100-person cohort.
Recorded deaths
13,550 successful summits · 26,316 expedition-member records.
2.54% deaths per summit and 1.31% deaths per member. Both report historical activity—not the risk for any one climber.
What should an actual expedition team do with these numbers?
Use the statistics to ask better questions of a route, operator and team. Do not use them to “calculate” a guaranteed outcome.
Before choosing a mountain
- Define the exact route and season, not only the mountain name.
- Review physical terrain, objective hazards and technical grades.
- Separate modern climbing experience from cumulative history.
- List prerequisites, support, communications and rescue constraints.
- Compare mountain difficulty against your own demonstrated experience.
Before choosing an operator
- Ask how summit/no-go decisions are made and who has authority.
- Ask what happens if fixed lines, weather or rescue plans fail.
- Get an explicit turnaround-time and descent-support policy.
- Read the exclusions in rescue membership and medical coverage.
- Ask for the operator’s own records with date and route context.
Carry the expedition pre-departure checklist into this discussion.
Research expedition operators →Understand remote rescue before a serious expedition.
Global Summit Guide is a Global Rescue Safe Travel Partner. Its rescue/evacuation memberships are separate from travel insurance; coverages, high-altitude options and exclusions must be checked against the actual itinerary. Partner relationships do not influence our mountain risk comparisons.
Equipment still matters, even when it cannot eliminate objective risk.
For planning a high-altitude kit, compare crampons, insulated layers, boots and protection systems against the actual route and operator requirements. Purchases through affiliated partners may support GSG at no extra cost to the reader.
Display advertising, if enabled for this page, is managed by the site’s Mediavine system. Travel marketplace modules such as Expedia or TourRadar are intentionally not forced onto this safety-statistics article. Affiliate links and operator sponsorships do not change the research conclusions.
Where these numbers came from—and where they stop.
The page is a historical research comparison, not a safety clearance or a current-season accident counter.
Primary comparison: The Himalayan Database public reports, covering expeditions through 2025, provide deaths, summit records and member records for the eight principal Nepal 8,000-metre peaks listed in our main table. Calculated rates reproduce its rounded ratios. This is the only multi-mountain numerical ranking on the page.
Other sources: Guinness World Records has a closely related February 2026 record (Annapurna: 75 deaths / 559 ascents = 13.42%; Dhaulagiri: 92 / 707 = 13.01%). Minor variations in counted ascents and publication cutoffs explain why its figures do not precisely match the live HDB table. Do not blend the two denominators in one ranking. The separately sourced K2 92/964 calculation is Global Summit Guide’s closed-through-2025 compilation; evaluate its assumptions and source list on the K2 page.
Editorial comparison: The six mountain risk profiles illustrate distinct historical hazards. They are not a data-derived ordering of the six “worst” peaks. Small-sample technical climbs, non-Nepal ranges and accidents outside the covered record are not forced into a universal table. Geographic scope, archival completeness, staff participation and time period all affect comparability.
Updates: Recheck the HDB report, Guinness publication dates, Pakistan peak compilations and any 2026 season incident updates before issuing a new numeric table. Event reports after the latest reconciled archival cutoff should be labeled separately instead of quietly inserted into one numerator while leaving the denominator unchanged.
Primary source for deaths, successful summits, expedition-member records and both historical rates.
Open original report →Scope, period (1905–2025), records and archive limitations.
Open summary →Independently displayed related record and ascent denominators, with different cutoff conventions.
Read the Guinness record →Separate Pakistan/Karakoram cumulative series; source cutoff and counting caveats.
Read the K2 method →Questions that make the numbers useful.
Which mountain has the highest death rate in 2026?
In the same-source Himalayan Database comparison of the eight principal Nepal 8,000-metre peaks, Annapurna I has the highest cumulative deaths-to-summits ratio: 75 deaths / 557 summits = 13.46%. The current database snapshot covers expeditions through 2025 and is not a live 2026 accident counter.
Is Annapurna more dangerous than K2?
Annapurna currently leads the comparable Nepal Himalayan Database deaths/summits table. K2 has a separate Pakistan climbing record and considerable technical and objective hazards. The two mountains cannot be declared universally safer or deadlier based on mixed historical ratios from different recording systems.
Does a 13% death-to-summit ratio mean 13 in 100 climbers die?
No. Recorded successful summit events are not the full population of climbers or attempts. Deaths/summits cannot be interpreted as the chance of death on one attempt, and 100 minus that figure is not a survival percentage.
Which mountain has killed the most people?
Everest has the largest recorded absolute fatality total in the Himalayan Database’s Nepal peaks: 344 deaths in its report. A mountain’s cumulative total reflects historical participation and exposure, not necessarily its highest percentage.
Why do some sites say Annapurna has a 32% death rate?
That figure is a widely repeated older cumulative death-to-ascent comparison, not the current report. Guinness’ 2018 record gave 27.6%, and its newer record gives 13.42%. The HDB public report currently lists 13.46%. Always read the cutoff and summit denominator.
Is Cho Oyu the safest 8,000-metre mountain?
Cho Oyu has the lowest cumulative deaths/summits ratio, 1.28%, among the eight principal Nepal 8,000-metre peaks in the current HDB table. That does not establish that any route is objectively “safe” or that it is the safest among all fourteen 8,000ers worldwide.
Should I use an operator’s summit success percentage to judge safety?
Ask for deaths, incidents, evacuation cases, number of clients, years, routes, staff exposure and the methodology used. A success rate without cohort definitions, failed-attempt recording and weather context is not a reliable safety guarantee.
Do mountain death rates improve over time?
Cumulative deaths-to-summits ratios can decrease when the number of successful summits grows, while real avalanche, icefall, weather and descent hazards remain. Recent-period comparisons also depend on the sample size and the exact exposure population.
Choose the next question—not just another article.
The best second page is the one that helps distinguish climbing difficulty, specific fatalities and current route decisions.
Read the Risk. Then Research the Route.
A percentage is a starting point. Choose the mountain, understand the hazards, compare legitimate source definitions and build a climbing plan that gives the descent as much attention as the summit.
The 10 Most Dangerous Mountains in the World
By the newer published death-to-ascent ratio, Annapurna I is the most dangerous major Himalayan peak, at 13.42% in the current Guinness World Records Nepal-Himalaya comparison, with Dhaulagiri I almost tied at 13.01%. By the strongest combination of fatality evidence, technical difficulty, objective hazard and weak rescue margin, K2 is the more serious mountain overall. The ranking below blends both, because “most dangerous” has more than one honest answer.
| # | Mountain | Why it ranks here | Current / historical context | Primary hazard |
|---|---|---|---|---|
| 1 | Annapurna I | Highest newer published Nepal-Himalaya ratio, plus major avalanche exposure | 13.42% published; historic shorthand ~27-32% | Avalanche, serac, altitude |
| 2 | K2 | Strongest mix of technical difficulty, objective hazard and weak rescue margin | 9.54% (GSG closed-through-2025); historic ~22-25% | Bottleneck serac, falls, storms, descent |
| 3 | Dhaulagiri I | Nearly tied with Annapurna in the current published Nepal-Himalaya ratio | 13.01% (92 deaths / 707 ascents) in the same dataset | Avalanche, weather, exposed upper mountain |
| 4 | Nanga Parbat | Lethal early-expedition history, huge relief and committing retreat | High historical band; current figures vary by source | Avalanche, storms, large faces, descent |
| 5 | Kangchenjunga | Remote 8,000er with severe weather and limited rescue margin | 7.83% in the current Nepal-Himalaya table | Weather, falls, remoteness |
| 6 | Makalu | Technical summit pyramid, extreme altitude and thinner support | 5.72% in the current Nepal-Himalaya table | Technical terrain, altitude, weather |
| 7 | Denali | Arctic cold, storms, crevasses and self-supported logistics amplify consequence | NPS incident reporting is more useful than one frozen ratio | Cold, storms, crevasses, falls |
| 8 | Matterhorn | Moderate grade turns lethal through speed, route-finding, congestion and descent | Large cumulative Alpine toll; ratio depends on denominator | Falls, rockfall, descent, storms |
| 9 | Mount Everest | Extreme altitude, icefall and huge exposure volume drive a large absolute toll | 2.50% in the current Nepal-Himalaya comparison | Altitude, icefall, exhaustion, weather |
| 10 | Cerro Torre | Elite technical difficulty and severe Patagonian weather, without a clean denominator | Not assigned a false precise percentage | Weather, rime ice, technical retreat |
Compare Every Peak’s Death Rate
Death rates only mean something in context. Explore each peak’s full analysis, or step up to the collection that ranks them all.
From the Numbers to the Events Behind Them
Death-rate statistics show patterns across mountains and eras. The Mountaineering Disasters archive examines the individual expeditions, avalanches, storms, accidents and decisions behind some of climbing history’s most consequential events.
Everest Disasters
K2 Disasters
Major Disasters Around the World
Deadliest Periods & Disaster Roundups
Was this helpful?
🏔Related safety data
🧭Explore & compare
Global Summit Guide is an independent mountaineering resource founded in 2026. The team combines first-hand trekking and climbing experience with in-depth research and professional health and nutrition review to help climbers choose objectives, prepare properly, and stay safe.
Health, altitude, and nutrition content is reviewed by Taylor Ludlow (Registered Nurse) and Brigg Hoopes (Nutritionist).
What We Don't Know Yet
Mountain information changes quickly. This box explains the limits of what this page can responsibly promise.
- Visa, passport, vaccination, border, insurance, and local transportation rules may change before your trip.
- Route conditions, snowpack, closures, and weather can change quickly after this page is updated.
- Permit rules, fees, quotas, and reservation windows may change between review cycles.
- Operator availability, pricing, guide ratios, and cancellation terms can change by season.
- Your fitness, altitude response, risk tolerance, and experience level may change what is safe or realistic.
Verify current conditions with official land managers, guide services, local forecasts, and current route reports before booking or climbing.
Mountaineering, rock and ice climbing, glacier travel, and high-altitude activity are inherently dangerous and can result in serious injury or death. The information on Global Summit Guide is provided for general informational and educational purposes only and is not a substitute for professional instruction, qualified guiding, proper equipment, or your own judgment and experience.
Route conditions, weather, snowpack, permits, regulations, and hazards change constantly and may differ from what is described here. Details may be incomplete, out of date, or contain errors. Always verify current information with local authorities, certified guides, and official sources before making any decision in the mountains.
Nothing on this site is medical, legal, or financial advice. Our fitness, acclimatization, altitude, and nutrition content is general in nature; consult a qualified physician before beginning any strenuous exercise program or exposing yourself to high altitude.
You are solely responsible for your own safety and decisions. To the fullest extent permitted by law, Global Summit Guide and its team accept no liability for any loss, injury, damage, or expense arising from use of, or reliance on, this information. By using this site you acknowledge these risks and accept these terms.
Some links on this site may be affiliate links. If you buy through them we may earn a small commission at no extra cost to you; this never affects our recommendations.
Global Summit Guide recommendation path
Next Best Mountain to Research
Use these recommendations to continue the right planning path instead of stopping on one page.
Use current permit, weather, route, and operator information before booking or climbing.