
Last updated October 12, 2026
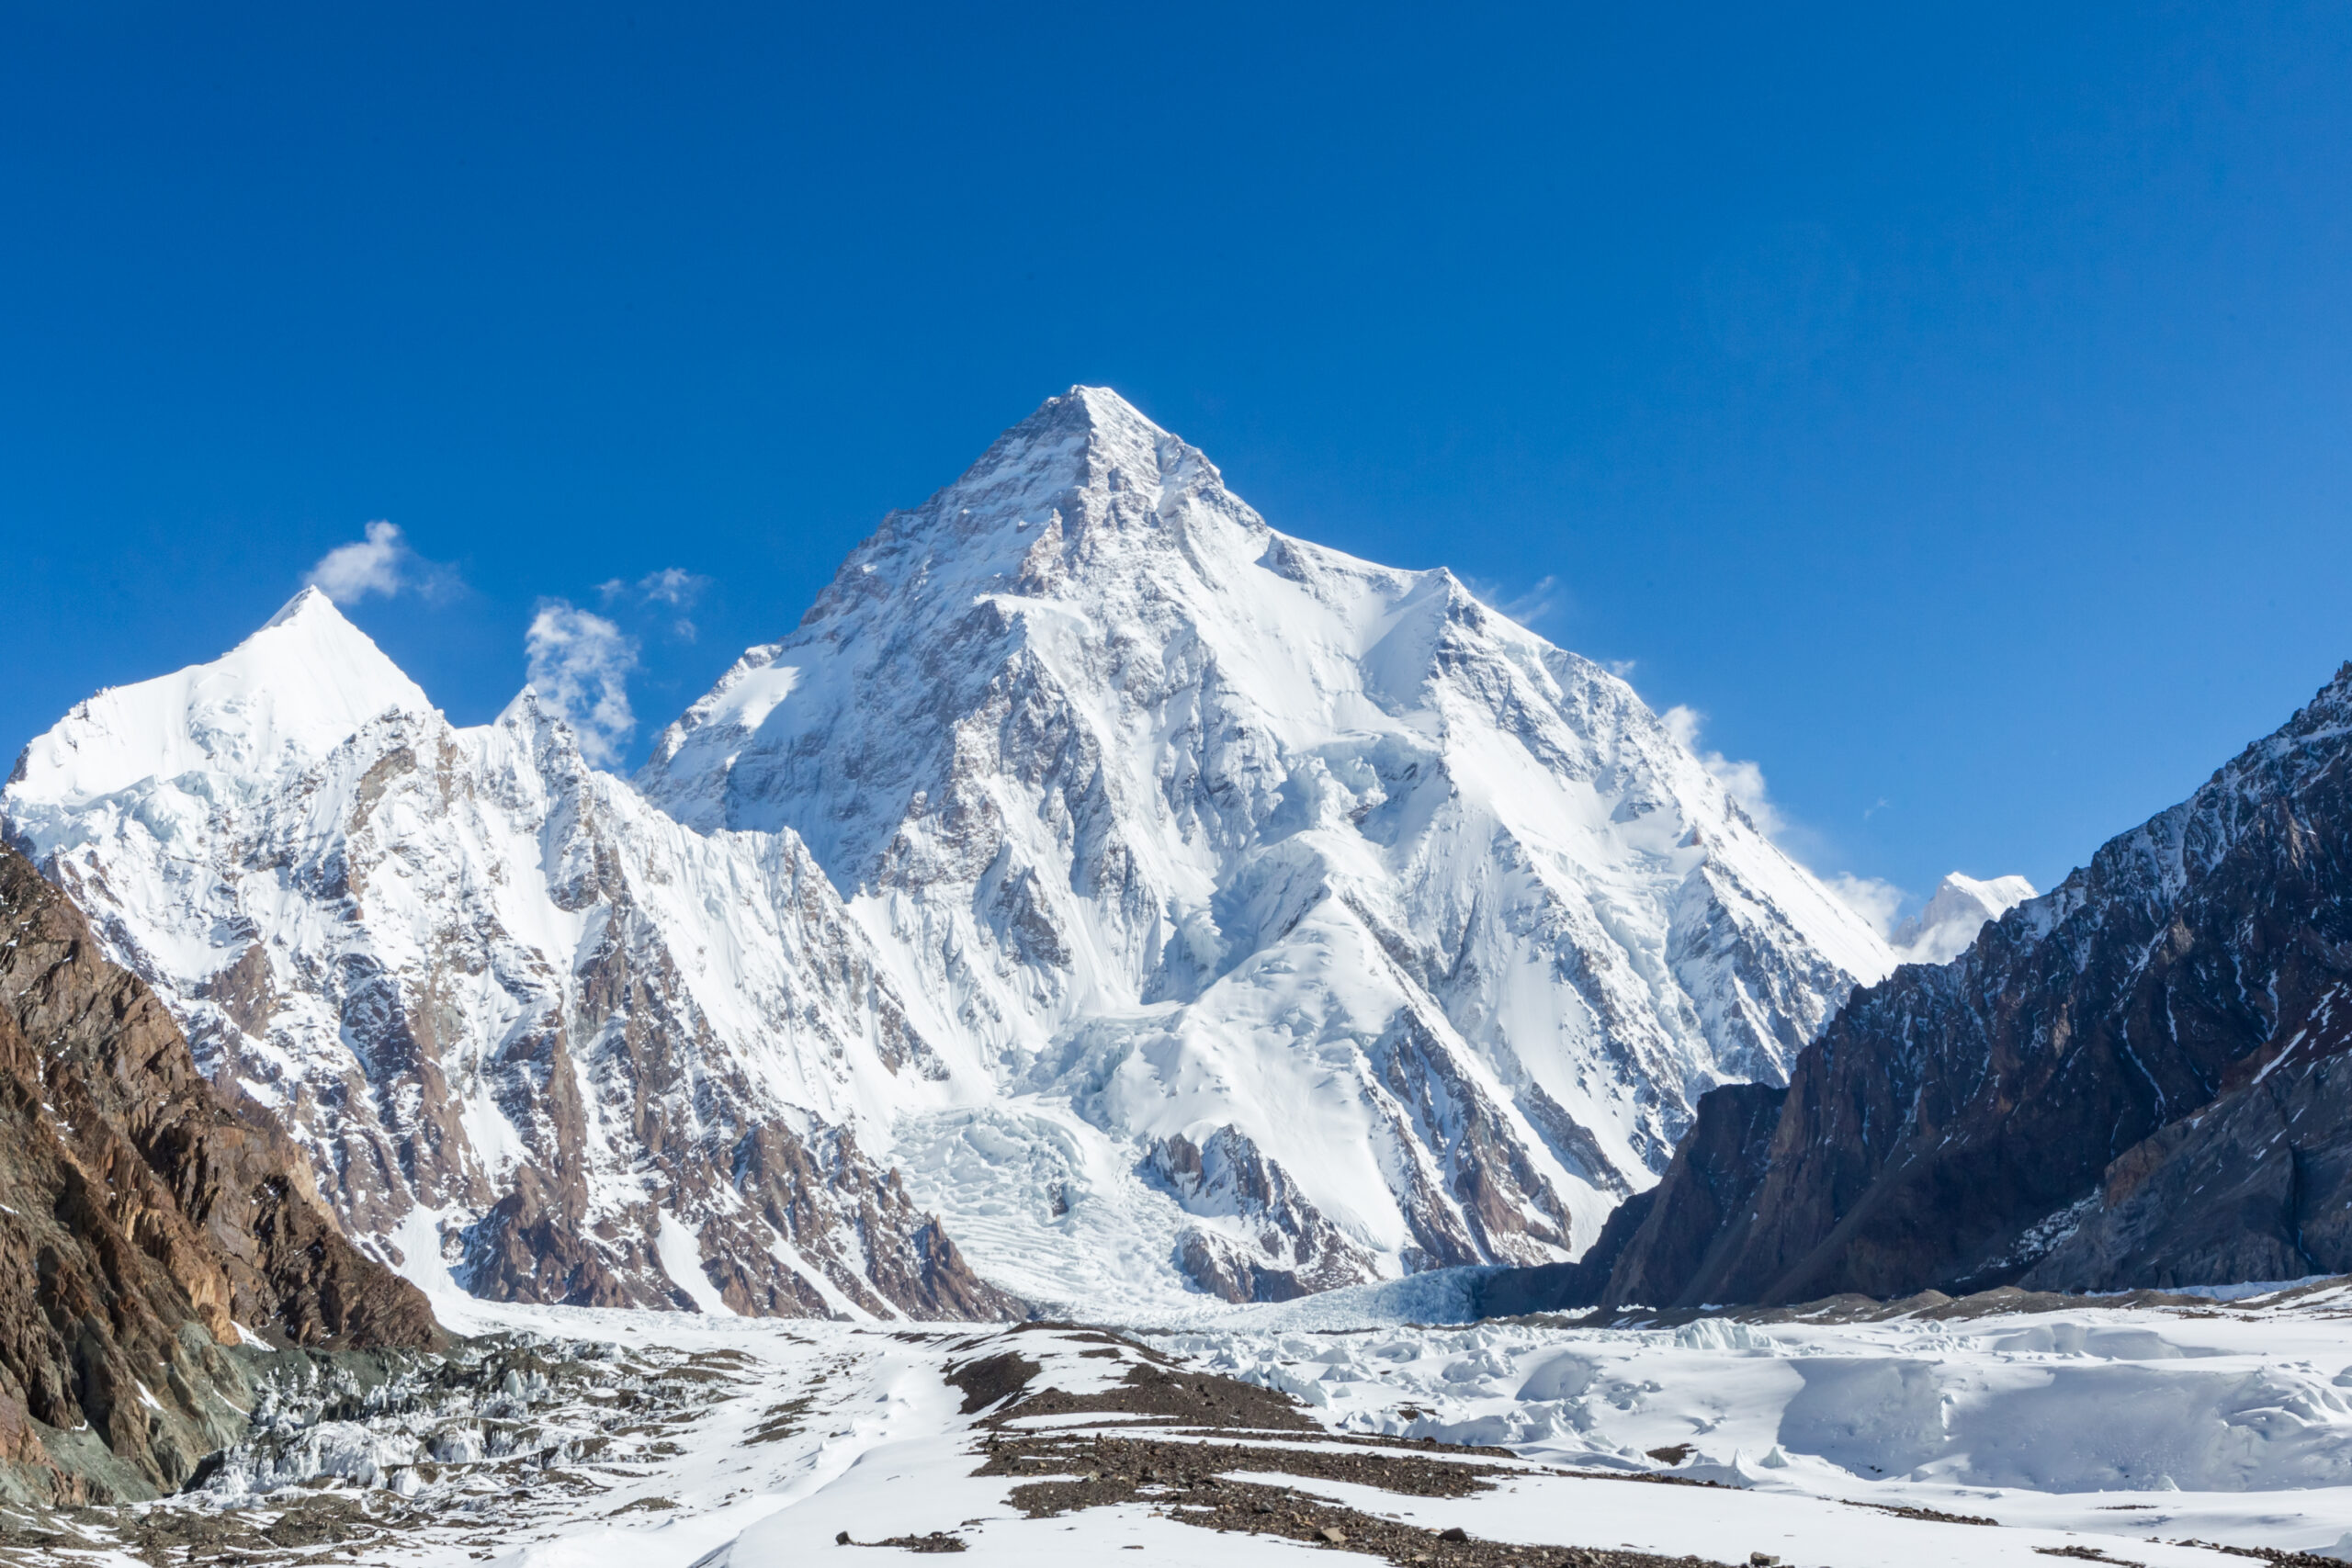
Death Rates by Mountain: The World’s Deadliest Peaks Ranked
Annapurna I currently leads the Himalayan Database’s comparable Nepal 8,000er table at 13.46 deaths per 100 recorded summits, narrowly ahead of Dhaulagiri I at 13.03%. K2’s separate closed-through-2025 compilation is 9.54%. Everest has the largest absolute toll but a much lower ratio. The answer changes because “deadliest” can mean ratio, total deaths, deaths per expedition member or overall climbing seriousness.
There Is No Single “Deadliest Mountain” Until You Define the Metric.
For a same-system death-to-summit comparison, Annapurna I is the current leader among Nepal’s 8,000ers at 75 deaths / 557 summits = 13.46%. Dhaulagiri I is almost tied at 92 / 706 = 13.03%.
K2 is outside the Himalayan Database’s Nepal series. Global Summit Guide’s separate closed-through-2025 compilation uses 92 deaths / 964 successful summits = 9.54%. The famous 22–25% K2 figure and ~27–32% Annapurna figures describe older cumulative eras.
If the question is total recorded deaths, Everest leads the current Himalayan Database table at 344. If the question is overall climbing seriousness, technical terrain, objective hazard, weather, retreat and rescue margin have to be discussed separately from one percentage.
Winner by Metric
These are deliberately separate. Combining them into one number creates false precision.
What Does “Mountain Death Rate” Actually Measure?
A percentage is useful only when the denominator is named. Mountain statistics are often contradictory because two sources are answering different questions with different populations.
| Metric | Formula | What It Tells You | What It Cannot Tell You |
|---|---|---|---|
| Deaths / summits | Recorded fatalities ÷ successful summits | Historical severity relative to summit volume; useful for long-term mountain comparison when the source system is consistent. | Your probability of dying on one attempt. Failed attempts and turnarounds are absent from the denominator. |
| Deaths / members | Recorded fatalities ÷ expedition members | A broader exposure denominator. The Himalayan Database publishes this alongside deaths/summits for its Nepal peaks. | A perfect attempt rate. “Member” still depends on expedition-record definitions and can include people with different roles or objectives. |
| Total deaths | All recorded fatalities | The cumulative human toll and the scale of historical exposure. | Relative danger. A mountain climbed thousands of times can accumulate more deaths than a rarely attempted mountain with a much higher ratio. |
| Recent-period mortality | Deaths ÷ a clearly defined modern climbing population | How outcomes in today’s expedition system differ from early mountaineering eras. | A permanent property of the mountain. One disaster can distort a short period, especially on low-traffic peaks. |
Successful Ascents Were Easier to Count
Long before online permit databases and GPS records, mountaineering histories could usually establish who reached a summit and who died. Complete attempt populations were much harder to reconstruct. Dividing fatalities by successful summits therefore became a simple historical comparison—even though the numerator and denominator are not opposite outcomes from one clean cohort.
Annapurna Still Looks Severe
The denominator problem does not disappear when we switch metrics. It does become informative that Annapurna leads the current HDB Nepal 8,000er table both in deaths/summits at 13.46% and deaths/members at 3.64%. Dhaulagiri and Kangchenjunga are also above 3% deaths/members in the same report.
What Do You Mean by “Deadliest”?
Switch the denominator and the ranking changes. K2 appears only where a defensible comparable figure exists; its Pakistan/Karakoram source system is labeled separately.
Choose a Metric
The first three views are quantitative. “Historic headline” explains the older numbers that built each mountain’s reputation.
Death-to-Summit Ratio vs. Total Summit Volume
The horizontal axis uses a logarithmic scale because Everest has vastly more summits than Annapurna or Dhaulagiri. Circle size reflects recorded deaths.
Tap a mountain point.
Eight filled points use the same Himalayan Database system. K2 is shown with an outlined point because its 92-death / 964-summit figure comes from a separate closed-through-2025 compilation.
Nepal 8,000ers: Himalayan Database Comparison
This is the cleanest current table because all eight rows come from the same report and use the same columns.
| Mountain | Deaths | Summits | Members | Deaths / Summits | Deaths / Members | Confidence |
|---|---|---|---|---|---|---|
| Annapurna I | 75 | 557 | 2,059 | 13.46% | 3.64% | High |
| Dhaulagiri I | 92 | 706 | 2,999 | 13.03% | 3.07% | High |
| Kangchenjunga | 54 | 682 | 1,749 | 7.92% | 3.09% | High |
| Makalu | 51 | 886 | 2,898 | 5.76% | 1.76% | High |
| Manaslu | 90 | 3,238 | 7,085 | 2.78% | 1.27% | High |
| Everest | 344 | 13,550 | 26,316 | 2.54% | 1.31% | High |
| Lhotse | 25 | 1,465 | 3,477 | 1.71% | 0.72% | High |
| Cho Oyu | 52 | 4,056 | 9,208 | 1.28% | 0.56% | High |
Open the Himalayan Database Most Dangerous Peaks report → Open the Guinness comparison →
Famous Historical Numbers vs. Current Cumulative Ratios
The old statistics were often accurate for their period. The error is repeating them decades later without the date or denominator.
From the “one in three” era to ~13.5%
Guinness’ 2018 record page used 27.6%; other historic comparisons often rounded Annapurna near 30–32%. The current HDB table has 75 deaths and 557 summits. More successful ascents expanded the denominator; avalanche and serac exposure did not disappear.
From the “one in four” shorthand to 9.54%
The familiar 25% K2 number belongs to an earlier cumulative era. The closed-through-2025 GSG series uses 92 deaths and 964 successful summits. K2 remains exceptionally serious; the denominator simply no longer supports the old headline as a current cumulative ratio.
Calculate a Death-to-Summit Ratio—Then Read It Correctly
This calculator shows the arithmetic and immediately explains what the result does not mean.
Read this as about 13.46 recorded deaths per 100 recorded successful summits in the source series—not as a 13.46% chance that an individual climber dies.
Six Mountains, Six Risk Fingerprints
Numbers matter most when they lead back to terrain, weather, altitude and rescue margin.

Annapurna I
Its modern ratio remains the highest in the current Nepal 8,000er table. Guinness identifies a major fatality concentration around an avalanche zone near 5,900 m between Camps II and III.
Photo: Bijay Chaurasia · CC BY-SA 4.0 · Wikimedia Commons
K2
K2’s ratio sits below Annapurna and Dhaulagiri’s current comparable Nepal figures, but its sustained technical terrain, Bottleneck serac exposure, violent weather and poor rescue margin make it exceptionally serious.

Dhaulagiri I
Dhaulagiri is the surprise of the modern comparison: 92 recorded deaths and 706 summits put it almost level with Annapurna by death-to-summit ratio.
Photo: Solundir · CC BY-SA 3.0 · Wikimedia Commons

Nanga Parbat
Nanga Parbat’s “Killer Mountain” reputation comes from a lethal early history, enormous relief, avalanche terrain, unstable weather and committing descent. Modern total/summit figures remain less standardized than the Nepal HDB set.
Photo: Guilhem Vellut · CC BY-SA 2.0 · Wikimedia Commons

Kangchenjunga
The third-highest mountain combines a high same-system fatality ratio with remote approaches, difficult upper terrain, severe weather and limited rescue options.
Photo: Johannes Bahrdt · CC BY-SA 4.0 · Wikimedia Commons

Makalu
Makalu’s current ratio is lower than the Annapurna–Dhaulagiri tier, but the technical summit pyramid, extreme altitude and smaller support footprint keep the climb highly committing.
Photo: Ben Tubby · CC BY 2.0 · Wikimedia Commons
Why Different Mountains Kill Climbers in Different Ways
Two peaks can produce similar cumulative ratios through completely different hazard systems. Planning improves when the statistic points back to the mechanism.
Avalanche
Annapurna, Dhaulagiri, Manaslu, K2 and Denali all contain terrain where avalanche exposure can overwhelm a competent team. Forecasting, timing and snow assessment can reduce exposure, but no climber can completely control a loaded slope or a large natural avalanche path.
Serac & Icefall Collapse
K2’s Bottleneck, Annapurna’s hanging ice and Everest’s Khumbu Icefall illustrate the same hard truth at different elevations: climbers sometimes have to pass beneath or through moving ice. Faster movement can reduce time exposed; it cannot make hanging glaciers static.
Extreme Altitude
Everest, Cho Oyu, Makalu and every 8,000er eventually enter an environment where hypoxia degrades pace, judgment, coordination and recovery. Technical ease lower on a route does not protect a climber from HACE, HAPE, exhaustion or inability to descend.
Falls & Rockfall
Matterhorn, K2, Nanga Parbat and Cerro Torre show why difficulty and fatality rate are separate concepts. Steep rock, mixed terrain, route-finding errors, unstable stone and fatigue on descent can turn one mistake into an unrecoverable fall.
Storm, Wind & Cold
Denali, K2, Everest and Rainier can turn delay into a survival problem. Wind removes heat, cloud destroys navigation, snow changes avalanche conditions and a storm can prevent rescue from reaching terrain that would otherwise be survivable.
Human Factors
Summit pressure, sunk cost, crowding, weak communication, late turnaround and declining pace rarely appear neatly in a database’s “cause” field. They often determine how long a climber remains exposed to the objective hazard that is eventually recorded as the fatal event.
Data Confidence: What Can Actually Be Compared?
A mountain can be dangerous even when the denominator is too weak for a clean global ranking.
Nepal Himalayan Database Peaks
Everest, Dhaulagiri, Manaslu, Annapurna, Kangchenjunga, Cho Oyu, Makalu and Lhotse can be compared inside the same current HDB report using deaths, summits and expedition members.
K2
The 92 / 964 closed-through-2025 series is defensible when the cutoff and source rules are stated. It is not part of the Nepal HDB table, so the page labels it as a cross-dataset reference.
Nanga Parbat & Other Pakistan Peaks
Good expedition history exists, but current standardized denominators are not as cleanly exposed in one public table as the Nepal HDB series.
Denali & Rainier
NPS incident and seasonal climbing reports are excellent for modern safety analysis, but they should not be forced into the same all-history deaths/summits table as the Himalayan Database.
Matterhorn & Mont Blanc
Both have enormous climbing histories and substantial cumulative death tolls, but no single standardized summit denominator makes a precise global death-rate rank trustworthy.
Cerro Torre & Elite Technical Peaks
Technical seriousness can be extreme while the climbing population is small and historical attempt/summit records are incomplete. A decimal percentage would suggest more certainty than the data supports.
The 10 Most Dangerous Mountains Overall
This is an editorial seriousness ranking—not a death-rate league table. It weighs fatality evidence with technical terrain, objective hazard, altitude, retreat difficulty, weather and rescue margin.
Annapurna I
Highest current HDB death/summit ratio among Nepal 8,000ers plus severe avalanche and serac exposure.
K2
Sustained technical climbing, Bottleneck serac, severe storms and limited rescue create perhaps the strongest overall seriousness profile.
Dhaulagiri I
13.03% current HDB ratio with avalanche, weather and isolated upper-mountain exposure.
Nanga Parbat
Huge faces, lethal historical record, avalanche exposure, unstable weather and difficult retreat.
Kangchenjunga
7.92% current HDB ratio plus remote rescue, severe weather and consequential descent.
Makalu
Technical summit pyramid, extreme altitude and less developed rescue/support than Everest or Manaslu.
Denali
Arctic latitude, violent storms, glacier hazards and self-supported loads create a very different but serious risk system.
Matterhorn
Falls, rockfall, route-finding mistakes, congestion and descent fatigue create a large cumulative Alpine toll.
Mount Everest
Lower ratio than the leaders, but extreme altitude, Khumbu Icefall exposure and enormous traffic produce the largest HDB death total.
Cerro Torre
Elite technical terrain, Patagonian wind, rime ice and difficult retreat make it serious despite the absence of a clean global fatality denominator.
Deadliness Changes Over Time
Guinness notes that Himalayan mountain fatality rates have generally declined. The terrain is not becoming gentler; climbing systems are changing.
Better Timing
Higher-resolution weather models and expedition forecasting help teams avoid some storms and choose summit windows more precisely.
Better Protection
Clothing, tents, oxygen hardware, communications and technical equipment are materially better than in the early expedition era.
More Developed Systems
Commercial expedition infrastructure, fixed ropes, experienced high-altitude workers and established camps can improve efficiency on normal routes.
Faster Lower-Mountain Evacuation
Helicopter rescue in Nepal cannot solve every upper-mountain emergency, but it can dramatically shorten evacuation time in terrain where flight is possible.
Peak-Specific Data & Adjacent Metrics
Annapurna Death Rate
Why the famous ~32% figure became outdated and how avalanche geography shapes the modern interpretation.
Open Annapurna data → K2K2 Death Rate
92 deaths, 964 summits and the closed-through-2025 calculation behind 9.54%.
Open K2 data → Nanga ParbatNanga Parbat Death Rate
The history behind the “Killer Mountain” reputation and why modern totals need careful source labels.
Open Nanga Parbat → MakaluMakalu Death Rate
Current Himalayan Database context and the technical summit-pyramid risk profile.
Open Makalu → Cho OyuCho Oyu Death Rate
The lowest current ratio among the Nepal Himalayan 8,000ers still describes an extreme-altitude expedition.
Open Cho Oyu → Alpine comparisonMatterhorn Death Rate
Why a very large cumulative Alpine toll cannot be cleanly forced into the Himalayan deaths/summits framework.
Open Matterhorn → Fatality geographyEverest Death Map
Interactive Nepal/Tibet route zones, causes, bodies and role-specific fatality geography.
Open Everest map → Difficulty8,000ers Ranked by Difficulty
Separate technical difficulty and objective hazard from the fatality ratio.
Compare difficulty →Deadliest Mountains FAQ
Which mountain has the highest death rate?
In the current Himalayan Database same-system comparison, Annapurna I has the highest deaths-to-summits ratio among Nepal’s 8,000-metre peaks at 13.46%, narrowly ahead of Dhaulagiri I at 13.03%. K2’s separately compiled closed-through-2025 ratio is 9.54%.
What is the most dangerous mountain in the world?
There is no single objective answer until the metric is defined. Annapurna leads the current comparable Nepal-Himalaya death-to-summit ratio. Everest has the largest absolute death total in the HDB. K2 is often judged more serious overall because of technical climbing, objective hazard, severe weather and weak rescue margin.
Does a 13% death-to-summit ratio mean 13% of climbers die?
No. The denominator is successful summits, not every climber who attempted the mountain. Turnarounds, failed attempts, repeat climbers and support workers all complicate the relationship.
What is K2’s current death rate?
Global Summit Guide’s closed-through-2025 compilation uses 92 deaths and 964 successful summits, or 9.54%. The famous 22–25% figure is historical.
What is Annapurna I’s current ratio?
The current Himalayan Database report lists 75 deaths and 557 summits, or 13.46%. Guinness currently publishes a closely related 13.42% figure using 75 deaths and 559 climbs. The slight difference reflects cutoff timing or counting definitions.
Which 8,000er has the most total deaths?
Everest leads the current Himalayan Database Nepal series with 344 recorded deaths. Its 2.54% death-to-summit ratio is much lower than Annapurna or Dhaulagiri because Everest has accumulated 13,550 recorded summits in the same report.
Which Nepal 8,000er has the lowest death-to-summit ratio?
Cho Oyu is lowest in the current HDB table at 1.28%, followed by Lhotse at 1.71%. “Lowest” remains relative: both are extreme-altitude mountains where weather, crevasses and altitude illness can be fatal.
Why do old articles say Annapurna is 32% and K2 is 25%?
Those numbers came from earlier cumulative periods when the mountains had far fewer successful summits. As summit totals expanded, the denominator grew faster than fatalities and the cumulative percentages fell.
Why do Guinness and the Himalayan Database show slightly different current numbers?
They use closely related data but can reflect different cutoff dates or counting definitions. The current HDB report has Annapurna at 75 deaths / 557 summits = 13.46%; Guinness publishes 75 / 559 = 13.42%. The difference is too small to change the substantive conclusion.
Read the Denominator Before You Read the Percentage.
Annapurna leads the current comparable Nepal 8,000er death-to-summit table. Everest leads total deaths. K2 remains one of the world’s most serious climbing objectives despite a lower modern cumulative ratio than its famous historical number. None of those statements conflict once the metric and source are visible.
The 10 Most Dangerous Mountains in the World
By the newer published death-to-ascent ratio, Annapurna I is the most dangerous major Himalayan peak, at 13.42% in the current Guinness World Records Nepal-Himalaya comparison, with Dhaulagiri I almost tied at 13.01%. By the strongest combination of fatality evidence, technical difficulty, objective hazard and weak rescue margin, K2 is the more serious mountain overall. The ranking below blends both, because “most dangerous” has more than one honest answer.
| # | Mountain | Why it ranks here | Current / historical context | Primary hazard |
|---|---|---|---|---|
| 1 | Annapurna I | Highest newer published Nepal-Himalaya ratio, plus major avalanche exposure | 13.42% published; historic shorthand ~27-32% | Avalanche, serac, altitude |
| 2 | K2 | Strongest mix of technical difficulty, objective hazard and weak rescue margin | 9.54% (GSG closed-through-2025); historic ~22-25% | Bottleneck serac, falls, storms, descent |
| 3 | Dhaulagiri I | Nearly tied with Annapurna in the current published Nepal-Himalaya ratio | 13.01% (92 deaths / 707 ascents) in the same dataset | Avalanche, weather, exposed upper mountain |
| 4 | Nanga Parbat | Lethal early-expedition history, huge relief and committing retreat | High historical band; current figures vary by source | Avalanche, storms, large faces, descent |
| 5 | Kangchenjunga | Remote 8,000er with severe weather and limited rescue margin | 7.83% in the current Nepal-Himalaya table | Weather, falls, remoteness |
| 6 | Makalu | Technical summit pyramid, extreme altitude and thinner support | 5.72% in the current Nepal-Himalaya table | Technical terrain, altitude, weather |
| 7 | Denali | Arctic cold, storms, crevasses and self-supported logistics amplify consequence | NPS incident reporting is more useful than one frozen ratio | Cold, storms, crevasses, falls |
| 8 | Matterhorn | Moderate grade turns lethal through speed, route-finding, congestion and descent | Large cumulative Alpine toll; ratio depends on denominator | Falls, rockfall, descent, storms |
| 9 | Mount Everest | Extreme altitude, icefall and huge exposure volume drive a large absolute toll | 2.50% in the current Nepal-Himalaya comparison | Altitude, icefall, exhaustion, weather |
| 10 | Cerro Torre | Elite technical difficulty and severe Patagonian weather, without a clean denominator | Not assigned a false precise percentage | Weather, rime ice, technical retreat |
Compare Every Peak’s Death Rate
Death rates only mean something in context. Explore each peak’s full analysis, or step up to the collection that ranks them all.
From the Numbers to the Events Behind Them
Death-rate statistics show patterns across mountains and eras. The Mountaineering Disasters archive examines the individual expeditions, avalanches, storms, accidents and decisions behind some of climbing history’s most consequential events.
Everest Disasters
K2 Disasters
Major Disasters Around the World
Deadliest Periods & Disaster Roundups
Was this helpful?
🏔Related safety data
🧭Explore & compare
Global Summit Guide is an independent mountaineering resource founded in 2026. The team combines first-hand trekking and climbing experience with in-depth research and professional health and nutrition review to help climbers choose objectives, prepare properly, and stay safe.
Health, altitude, and nutrition content is reviewed by Taylor Ludlow (Registered Nurse) and Brigg Hoopes (Nutritionist).
What We Don't Know Yet
Mountain information changes quickly. This box explains the limits of what this page can responsibly promise.
- Weather, snowpack, avalanche risk, road access, and route conditions can change quickly and may be different on your climbing dates.
- Comparisons simplify complex decisions; the better mountain depends on current conditions, skills, timing, budget, and risk tolerance.
- Route conditions, snowpack, closures, and weather can change quickly after this page is updated.
- Permit rules, fees, quotas, and reservation windows may change between review cycles.
- Operator availability, pricing, guide ratios, and cancellation terms can change by season.
Verify current conditions with official land managers, guide services, local forecasts, and current route reports before booking or climbing.
Mountaineering, rock and ice climbing, glacier travel, and high-altitude activity are inherently dangerous and can result in serious injury or death. The information on Global Summit Guide is provided for general informational and educational purposes only and is not a substitute for professional instruction, qualified guiding, proper equipment, or your own judgment and experience.
Route conditions, weather, snowpack, permits, regulations, and hazards change constantly and may differ from what is described here. Details may be incomplete, out of date, or contain errors. Always verify current information with local authorities, certified guides, and official sources before making any decision in the mountains.
Nothing on this site is medical, legal, or financial advice. Our fitness, acclimatization, altitude, and nutrition content is general in nature; consult a qualified physician before beginning any strenuous exercise program or exposing yourself to high altitude.
You are solely responsible for your own safety and decisions. To the fullest extent permitted by law, Global Summit Guide and its team accept no liability for any loss, injury, damage, or expense arising from use of, or reliance on, this information. By using this site you acknowledge these risks and accept these terms.
Some links on this site may be affiliate links. If you buy through them we may earn a small commission at no extra cost to you; this never affects our recommendations.
Global Summit Guide recommendation path
Next Best Mountain to Research
Use these recommendations to continue the right planning path instead of stopping on one page.
Use current permit, weather, route, and operator information before booking or climbing.