
Last updated July 9, 2026
State of Mountaineering 2026: Trends, Data & Analysis
Permit economics, summit success, fatality rates, and a climate story arriving faster than the models predicted. Our annual report on the state of global climbing, across 100 peaks.
Mountaineering in 2026 is more expensive, better documented, and less deadly per climber than a decade ago — but the totals keep rising because far more people climb. Nepal’s Everest permit hit US$15,000, up roughly 320% per climber since 2014. Route length, not fitness, is the strongest predictor of summit success on Kilimanjaro. And the glaciers are going faster than projected: Venezuela lost its last one in 2024.
Executive summary
Five findings that define the year.
Permit economics have split East from West
Nepal’s Everest permit reached US$15,000 per climber in September 2025, while Pakistan’s 8,000 m royalties remain near US$1,800 — a stark divide in access economics between two ranges of comparable difficulty. Meanwhile 62 of the 100 peaks in our database require no climbing permit at all.
On Kilimanjaro, time beats fitness
Summit success tracks route length far more tightly than climber strength: the 5-day Marangu route succeeds ~45% of the time; the 9-day Northern Circuit ~90%. Africa’s most commercially climbed peak has a mediocre overall success rate largely because budget operators sell compressed itineraries.
“Deadliest” and “hardest” are different questions
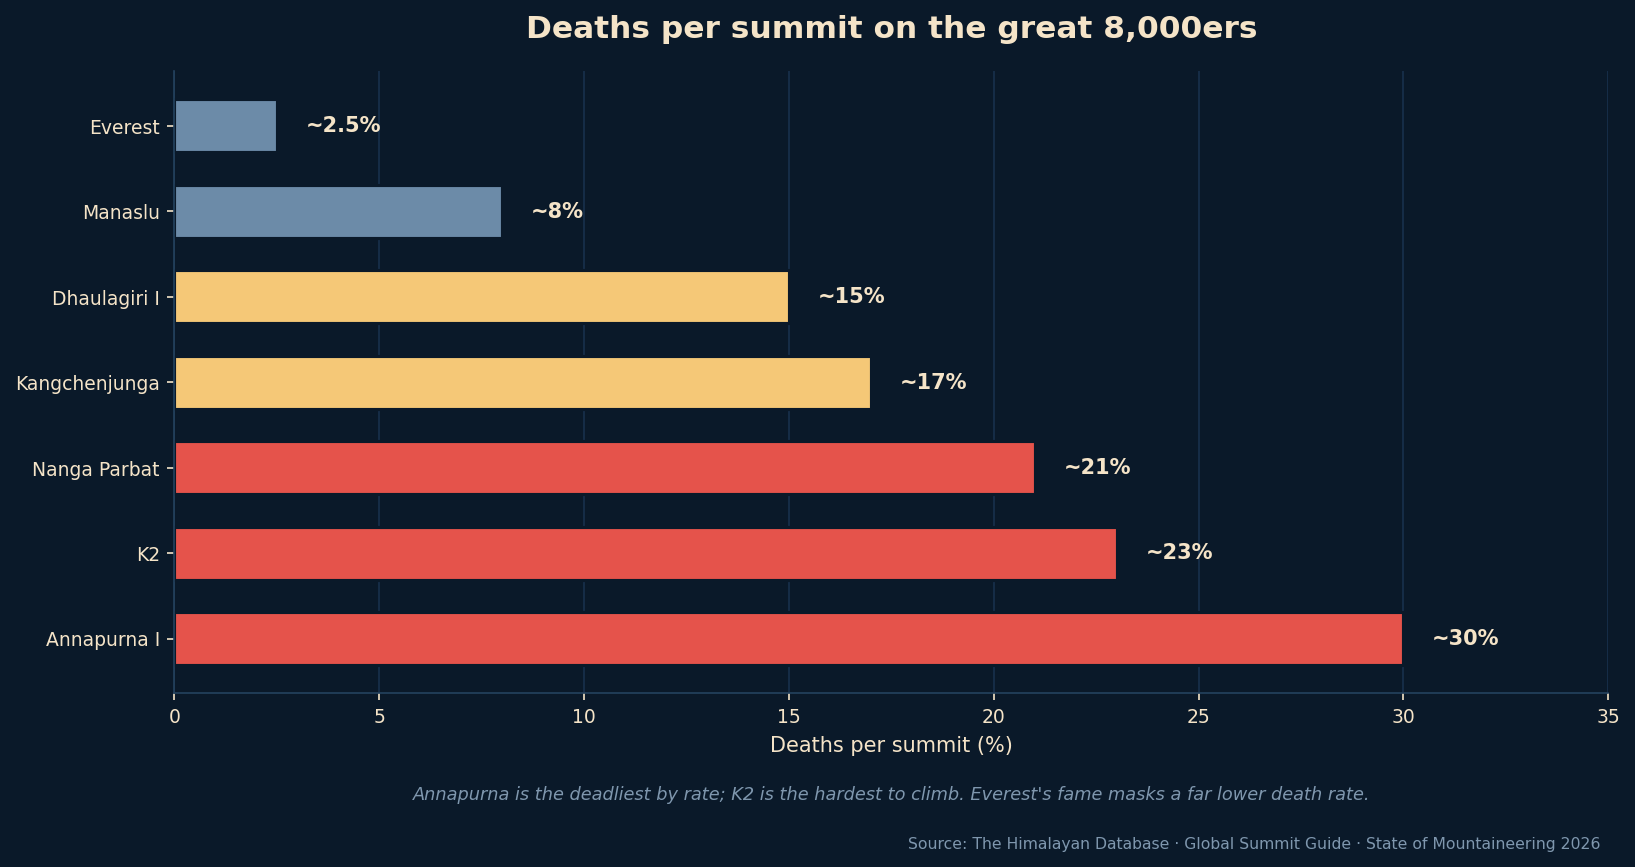
By deaths per summit, Annapurna I (~30%) is the deadliest of the great peaks, ahead of K2 (~23%). But K2 is consistently rated the hardest to climb. Everest — despite its reputation — sits near 2.5%, its risk mitigated by fixed ropes, oxygen, and Sherpa support.
Trekking peaks are quietly taking over
Nepal’s certified trekking peaks — Island, Mera, Lobuche East — now account for more than 35% of all Himalayan permits issued, as climbers seek real mountaineering without expedition-peak cost or technical demand.
The glaciers are going faster than modelled
Venezuela lost its last glacier in May 2024, the first Andean country to do so. Mexico’s last, on Pico de Orizaba, is projected to lose functional status around 2030. In the Alps, thawing permafrost is destabilizing the Matterhorn and Mont Blanc, extending rockfall seasons and closing classic routes mid-summer.
On this page
01 · Permit & access economics
The single largest government fee in the sport just got larger.
Find Hotels, Flights & Trips for the World’s Best Hiking Destinations
The Global Summit Guide Travel Shop on Expedia — curated for outdoor adventurers, mountaineers, and serious hikers. Patagonia to the Alps. Nepal to the Rockies. Curated lodging for every region we cover.
Explore Travel Shop on Expedia →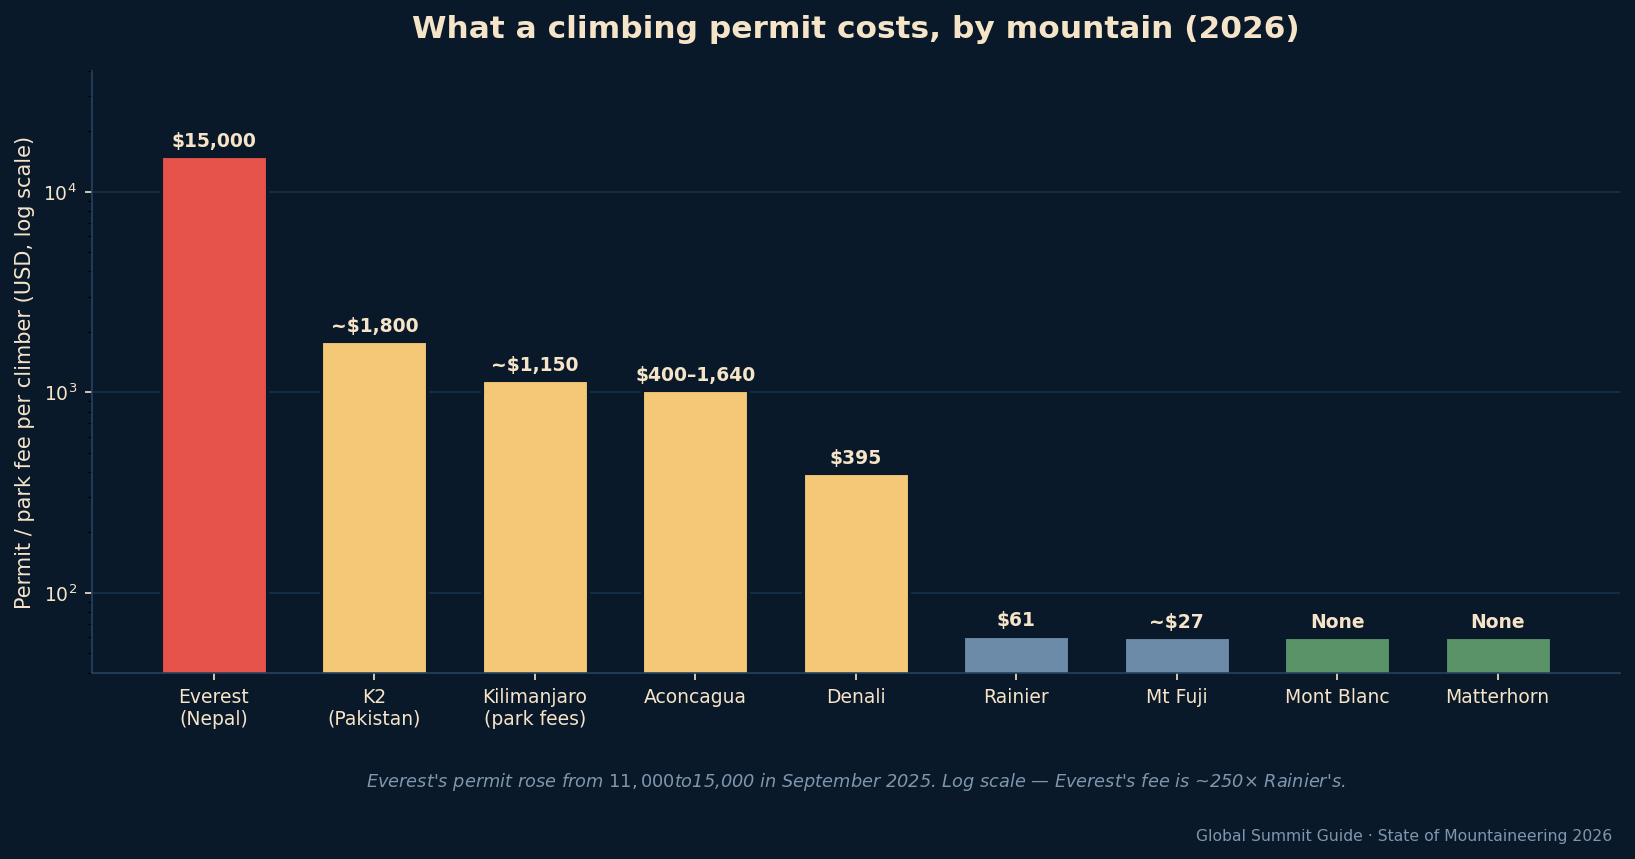
Figure 1. Permit and park fees per climber, 2026. Log scale — Everest’s fee is roughly 250× Rainier’s.
In September 2025, Nepal raised the Everest climbing permit from US$11,000 to US$15,000 per climber for the spring season, plus a separate US$4,000 garbage deposit. Set against the historical baseline the increase is steeper than it first appears. Before 2015, Nepal charged roughly US$25,000 for a team of up to seven — about US$3,600 per climber. The 2015 restructuring moved to $11,000 per person, and 2025 took it to $15,000. Measured per climber, the fee has risen roughly 320% in a decade.
| Region | Permit range | Notes |
|---|---|---|
| Nepal | US$250 – 15,000 | Everest dominates; 97 remote peaks are fee-waived through 2027 |
| Pakistan | ~US$1,800+ | 8,000 m royalties far cheaper than Nepal’s |
| Tanzania / Kenya | US$800 – 1,500 | Park entry is the primary cost; no separate climbing permit |
| Argentina | US$400 – 1,640 | Mendoza provincial permit; varies by season, nationality, assistance |
| United States | US$61 – 395 | Denali US$395; Rainier US$61; park entry extra |
| Western Europe | None | Mont Blanc and the Matterhorn require no climbing permit |
Nepal’s Department of Tourism has signalled that a rise above $15,000 is plausible within two seasons, framed as crowd management as much as revenue. Pakistan, by contrast, has held its 8,000 m royalties low, and its peaks are harder and less commercially supported — an access-economics inversion that is starting to redirect experienced climbers toward the Karakoram. Full detail in our permits and fees by mountain guide.
02 · Summit success
The most actionable finding in this report.
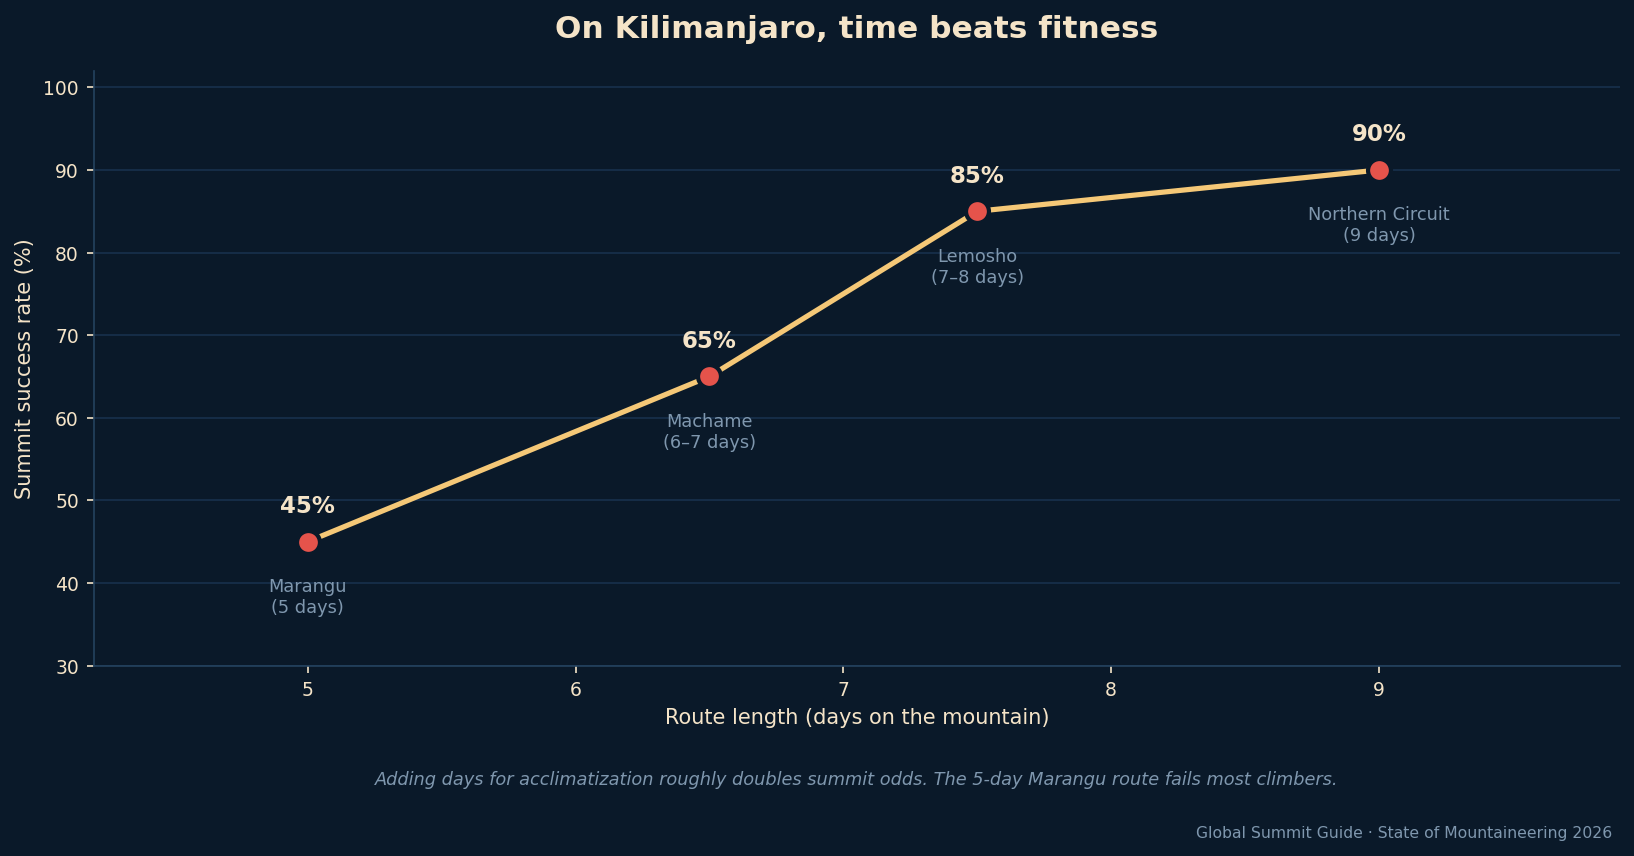
Figure 2. Kilimanjaro summit success by route length. Adding days for acclimatization roughly doubles a climber’s odds.
Kilimanjaro is the world’s most commercially climbed major mountain, and its overall summit success rate — around 65% — is stubbornly below what a non-technical trek should deliver. The reason is not fitness. It is itinerary length. The five-day Marangu route succeeds roughly 45% of the time; the nine-day Northern Circuit reaches about 90%. Every additional day on the mountain buys acclimatization that no amount of gym work substitutes for.
This is the clearest example in mountaineering of a market failure: the cheapest itineraries are the ones most likely to fail, and climbers rarely learn this before booking. It is also the single most useful thing we publish. If you take one number from this report, take this one — on Kilimanjaro, buy days, not gear.
03 · Fatality & risk
Two questions that get conflated: which mountain is deadliest, and which is hardest.
Figure 3. Deaths per summit on the great 8,000ers. Source: The Himalayan Database.
| Peak | Deaths per summit |
|---|---|
| Annapurna I | ~30% |
| K2 | ~23% |
| Nanga Parbat | ~21% |
| Kangchenjunga | ~17% |
| Dhaulagiri I | ~15% |
| Manaslu | ~8% |
| Everest | ~2.5% |
Annapurna I is the deadliest of the great peaks by rate — roughly one death for every three summits — driven by relentless avalanche and serac hazard rather than technical difficulty. K2 follows at ~23%. Yet K2, not Annapurna, is consistently rated the hardest mountain to climb: steep, sustained, technical, and effectively unrescuable above the Bottleneck. The two rankings answer different questions, and conflating them is the most common error in mountaineering journalism. See our K2 death rate analysis and 10 hardest mountains ranking.
Everest is the paradox. It holds the highest total death count of any mountain — nearly 340 since 1922 — while its rate per summit sits near 2.5%, and its modern per-climber rate near 1%. Fixed ropes, reliable forecasting, near-universal supplemental oxygen, and experienced Sherpa teams have driven the rate down even as the crowds have grown. Where deaths occur has barely changed: about 60% happen on the descent, and most in the Death Zone. See our Everest death map.
04 · Climate change on the peaks
The milestones are arriving ahead of the projections.
The clearest signals this year came not from the Himalaya but from lower, warmer ranges. Venezuela lost its last glacier in May 2024 — the remnant on Pico Humboldt — becoming the first Andean country with none. Pico Bolívar’s own ice vanished around 2012. Mexico’s last glacier, the Jamapa on Pico de Orizaba, shrank from 0.46 to 0.37 km² between 2019 and 2024, and UNAM researchers describe it as past the point of no return, with functional extinction projected near 2030.
In the Alps, thawing permafrost — the ice that cements high rock faces together — is destabilizing classic terrain. Rockfall seasons on the Matterhorn and Mont Blanc now start earlier and end later, and guides increasingly close routes mid-summer. The practical consequence for climbers is that “in condition” windows are moving and narrowing, and that route descriptions written a decade ago describe mountains that no longer exist in quite that form. See our reporting on the Jamapa Glacier and Pico Bolívar.
05 · Outlook
What we expect to matter over the next two seasons.
Permits will keep rising. Nepal has signalled a further Everest increase; a figure above $15,000 is plausible within two seasons, and other Himalayan nations tend to follow. Prerequisites are coming. Proposals requiring a prior 7,000 m summit for Everest applicants have gathered momentum, which would reshape the training-peak market overnight — and make Nepal’s 97 fee-waived peaks strategically valuable.
The Andes are underserved. Ecuador’s volcanoes (Cotopaxi, Chimborazo) and Bolivia’s glacier peaks (Illimani, Sajama) remain thinly covered in English despite affordability, accessibility, and dramatic terrain. As Himalayan costs climb and permits tighten, we expect the Andes to absorb a growing share of ambitious amateur climbing. And machine learning is arriving in expedition planning — weather forecasting, acclimatization scheduling, and gear selection are all being reshaped by tools that make professional-grade planning available to ordinary climbers.
Methodology & limitations
How this report was built
Sources. Fatality and summit data from The Himalayan Database (Salisbury & Hawley archive); permit structures from national tourism departments, park authorities, and mountaineering associations; cost data from published 2026 operator pricing; climate data from peer-reviewed glaciology and UNAM’s Jamapa monitoring.
Metrics. Fatality figures are deaths per summit unless stated otherwise. All costs are USD for the 2025–26 season. Permit costs reflect official government fees and may exclude park entrance, environmental deposits, and liaison-officer fees, which vary by peak.
Limitations. Participation data for many peaks is not systematically collected by governments and represents composite estimates from operator reports, guide associations, and permit records. Success-rate data is especially variable: Nepal publishes official permit and summit counts; most other countries do not. Where precise data is unavailable we use conservative ranges and say so. Climate projections draw on IPCC reports and peer-reviewed glaciology but are inherently uncertain in their precise timelines.
Corrections. This edition corrects the Everest permit figure (previously stated as $11,000; it is $15,000 as of September 2025), the associated decade-change calculation, and the fatality table, which previously mixed metrics. We publish corrections rather than quietly amending.
How to cite this report
Citation. Global Summit Guide. (2026). State of Mountaineering 2026: The Annual Report on Global Climbing.
Charts. The three figures in this report are original and free to reproduce with attribution to Global Summit Guide and a link to this page.
Corrections & data requests: if you spot an outdated permit fee, a changed route condition, or missing data, tell us — we update this report quarterly and publish corrections openly.
Frequently asked questions
How much does an Everest climbing permit cost in 2026?
US$15,000 per climber for Nepal’s spring season, raised from $11,000 in September 2025, plus a $4,000 garbage deposit. Before 2015 Nepal charged ~$25,000 per team of seven (~$3,600 each), so the per-climber fee has risen roughly 320% in a decade. See our Everest permits guide.
Which mountain has the highest death rate?
By deaths per summit, Annapurna I (~30%), then K2 (~23%) and Nanga Parbat (~21%). Everest sits near 2.5%. Note “deadliest” and “hardest” differ: K2 is rated the hardest to climb; Annapurna kills the highest share of those who summit.
What percentage of mountains require no permit?
62 of the 100 peaks in our database — including Mont Blanc, the Matterhorn, and most North American peaks outside protected parks. Fees on the rest span ~$27 (Mount Fuji) to $15,000 (Everest).
Does route choice affect summit success on Kilimanjaro?
Dramatically. The 5-day Marangu route succeeds ~45% of the time; the 9-day Northern Circuit ~90%. Route length predicts success better than fitness — adding acclimatization days roughly doubles your odds.
How much does an Everest expedition cost in 2026?
From ~$30,000 with budget Nepali operators to $300,000+ ultra-premium. A realistic mid-tier expedition runs $45,000–$100,000 all-in once flights, gear, insurance, tips, and contingency are added. The $15,000 permit is usually bundled — request an itemized inclusion list. See our cost framework.
Are glaciers disappearing from major climbing peaks?
Yes, faster than projected. Venezuela lost its last glacier in May 2024, the first Andean country with none. Mexico’s last, on Pico de Orizaba, is projected to lose functional status around 2030. Alpine permafrost thaw is destabilizing routes on the Matterhorn and Mont Blanc.
The most useful number in this report
On Kilimanjaro, route length predicts success better than fitness does. Everywhere else, permits decide whether you climb at all.
See permits & fees by mountain →Was this helpful?
🏔Related peaks nearby
🧭Explore & compare
Global Summit Guide is an independent mountaineering resource founded in 2026. The team combines first-hand trekking and climbing experience with in-depth research and professional health and nutrition review to help climbers choose objectives, prepare properly, and stay safe.
Health, altitude, and nutrition content is reviewed by Taylor Ludlow (Registered Nurse) and Brigg Hoopes (Nutritionist).
What We Don't Know Yet
Mountain information changes quickly. This box explains the limits of what this page can responsibly promise.
- Visa, passport, vaccination, border, insurance, and local transportation rules may change before your trip.
- Route conditions, snowpack, closures, and weather can change quickly after this page is updated.
- Permit rules, fees, quotas, and reservation windows may change between review cycles.
- Operator availability, pricing, guide ratios, and cancellation terms can change by season.
- Your fitness, altitude response, risk tolerance, and experience level may change what is safe or realistic.
Verify current conditions with official land managers, guide services, local forecasts, and current route reports before booking or climbing.
Part of this Global Summit Guide cluster
Explore the complete Mountains guide for more context, routes, planning links, and related resources.
Mountaineering, rock and ice climbing, glacier travel, and high-altitude activity are inherently dangerous and can result in serious injury or death. The information on Global Summit Guide is provided for general informational and educational purposes only and is not a substitute for professional instruction, qualified guiding, proper equipment, or your own judgment and experience.
Route conditions, weather, snowpack, permits, regulations, and hazards change constantly and may differ from what is described here. Details may be incomplete, out of date, or contain errors. Always verify current information with local authorities, certified guides, and official sources before making any decision in the mountains.
Nothing on this site is medical, legal, or financial advice. Our fitness, acclimatization, altitude, and nutrition content is general in nature; consult a qualified physician before beginning any strenuous exercise program or exposing yourself to high altitude.
You are solely responsible for your own safety and decisions. To the fullest extent permitted by law, Global Summit Guide and its team accept no liability for any loss, injury, damage, or expense arising from use of, or reliance on, this information. By using this site you acknowledge these risks and accept these terms.
Some links on this site may be affiliate links. If you buy through them we may earn a small commission at no extra cost to you; this never affects our recommendations.
Global Summit Guide recommendation path
Next Best Mountain to Research
Use these recommendations to continue the right planning path instead of stopping on one page.
Use current permit, weather, route, and operator information before booking or climbing.