
Last updated September 17, 2026

Kangchenjunga Summit Success Rate: What the Data Actually Shows
Kangchenjunga’s historical summit/member ratio is 39.0%: 682 summit records from 1,749 Himalayan Database member records through 2025. That number is useful—but only if the denominator stays attached. It is not a promise that a future climber has a 39% chance of reaching the top.

Kangchenjunga’s historical summit/member rate is 39.0%.
The current Himalayan Database comparison record lists 1,749 Kangchenjunga member records, 682 summit records and 54 deaths. Dividing summit records by member records gives 39.0%.
That is the most useful single historical success figure when Kangchenjunga is compared with other Nepal Himalayan 8,000ers using the same population definition. It replaces older web estimates that mixed incompatible attempt and permit denominators.
The fatality numbers need the same discipline. The 54 deaths equal 3.09% of member records. Dividing those same deaths by the 682 summit records gives 7.92 deaths per 100 summit records. Neither number means “1 in 7 climbers who attempt Kangchenjunga die.”
682 summit records ÷ 1,749 member records = 39.0%
This is the same member-record methodology used on Global Summit Guide’s cross-peak summit-success dataset.
| Metric | Value | Formula / source | What it means |
|---|---|---|---|
| Member records | 1,749 | Himalayan Database comparison record | Historical expedition-member records in the dataset; not necessarily unique individuals. |
| Summit records | 682 | Himalayan Database comparison record | Recorded successful ascents; repeat summiters can appear more than once. |
| Summit/member | 39.0% | 682 ÷ 1,749 | Historical outcome ratio used for direct comparison with other HDB peaks. |
| Deaths | 54 | Himalayan Database comparison record | Recorded deaths associated with Kangchenjunga expedition member records. |
| Deaths/member | 3.09% | 54 ÷ 1,749 | Deaths per historical member record. |
| Deaths/summits | 7.92% | 54 ÷ 682 | A legacy comparison metric; not a climber-attempt fatality probability. |
Why 28% and “1 in 7” are not the right headline metrics
Both numbers looked precise but could not be reproduced from one consistent population definition.
Members are not the same as permit holders.
A dataset can include expedition members, hired high-altitude workers, repeat climbers or different status categories. Mixing them with a permit estimate creates a ratio whose denominator is no longer clear.
Summits are not the same as unique summiters.
Repeat ascents can create more than one summit record for one person. The correct statement is therefore “682 summit records,” not necessarily “682 people.”
Deaths/summits is not deaths/attempts.
Using summit records as the denominator produces 7.92%. That can compare historical mountain records, but it cannot be rewritten as “7.92% of climbers die.”
One denominator makes cross-peak comparison possible.
Everest, Lhotse, Cho Oyu, Makalu, Annapurna I, Dhaulagiri I and Kangchenjunga can be compared meaningfully when all use the same HDB member-record framework.
Historical data still combines very different eras.
1955 expedition siege tactics and 2025 commercial support are not equivalent experiences. The 39.0% figure is therefore descriptive history, not an era-adjusted performance model.
Unsupported subgroup precision is worse than no number.
Exact success rates by experience level, support style or turnaround cause are not published unless a reproducible subset can be extracted and audited.
Where is Kangchenjunga?
Kangchenjunga rises on the Nepal–India border in the eastern Himalaya, between Taplejung in Nepal and Sikkim in India.
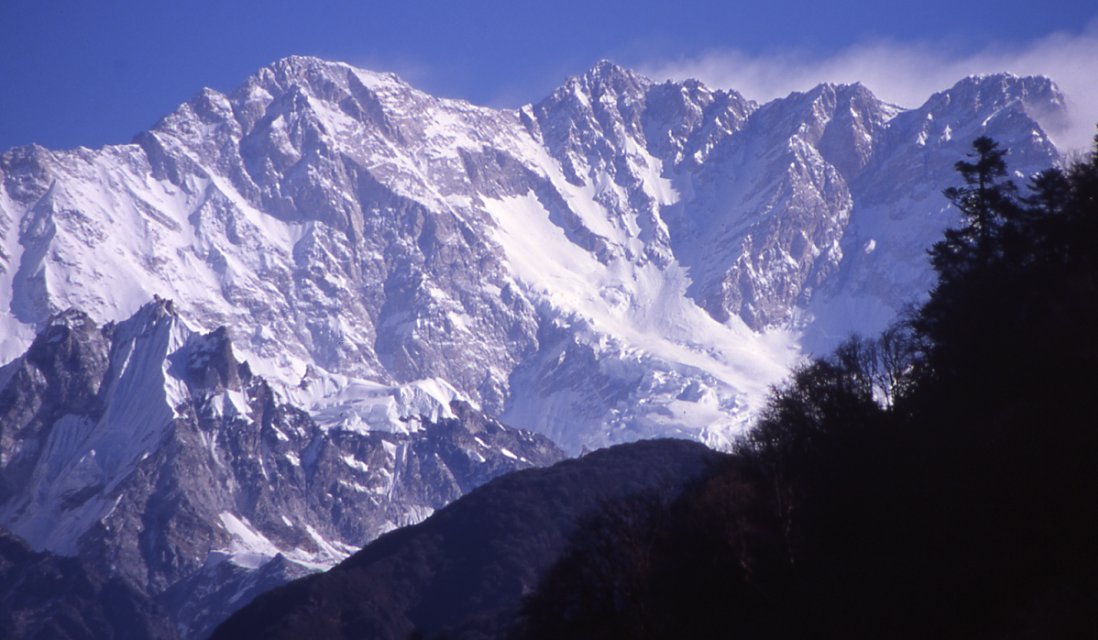
The Southwest Face is the route context behind most modern Kangchenjunga outcome data.
The Himalayan Database identifies Kangchenjunga’s Southwest Face as the standard 8,000-metre route. Historical AAJ reports describe the Nepal-side Yalung approach and the sequence through the lower icefall, Great Shelf, Gangway and upper mixed terrain that defines the first-ascent line and its descendants.

How Kangchenjunga compares with other major 8,000ers
Every figure below uses the same Himalayan Database member-record framework, so the comparison is far stronger than mixing operator estimates and deaths-per-summit ratios.
| Mountain | Members | Summits | Summit/member | Deaths | Deaths/member | Deaths/summits |
|---|---|---|---|---|---|---|
| Everest | 26,316 | 13,550 | 51.5% | 344 | 1.31% | 2.54% |
| Manaslu | 7,085 | 3,238 | 45.7% | 90 | 1.27% | 2.78% |
| Cho Oyu | 9,208 | 4,056 | 44.0% | 52 | 0.56% | 1.28% |
| Lhotse | 3,477 | 1,465 | 42.1% | 25 | 0.72% | 1.71% |
| Kangchenjunga | 1,749 | 682 | 39.0% | 54 | 3.09% | 7.92% |
| Makalu | 2,898 | 886 | 30.6% | 51 | 1.76% | 5.76% |
| Annapurna I | 2,059 | 557 | 27.1% | 75 | 3.64% | 13.46% |
| Dhaulagiri I | 2,999 | 706 | 23.5% | 92 | 3.07% | 13.03% |

Kangchenjunga’s statistics refer to the main 8,586-metre peak—not every summit in the massif.
The Kangchenjunga massif contains several high named summits, including Yalung Kang and Kangchenjunga South. The Himalayan Database tracks those peaks separately. Keeping the main-peak identity clean prevents subsidiary-peak ascents or deaths from silently changing the Kangchenjunga Main rate.

Why the Southwest Face matters to summit outcomes
The page can responsibly explain the route’s demands without inventing a separate 30%, 35% or 22% route success rate that the published dataset does not reproduce.
Icefall and heavily glaciated terrain consume time early.
Historical first-ascent and later normal-route accounts describe a complex lower approach through the Yalung glacier system. Route preparation begins well before the high camps.
The Great Shelf and Gangway are structural route features.
The standard line works across the broad upper snow-and-ice system before the summit cone. Conditions determine whether those sections are relatively direct or slow and hazardous.
Technical movement remains above 8,000 metres.
Historical route reports include steep snow, mixed terrain and rock near the summit. That is a very different finishing problem from a non-technical snow walk.
Reversing the route belongs in the outcome model.
A summit record says the climber reached the top; it does not erase the exposure of descending complex terrain while exhausted and hypoxic.
The expedition system has less redundancy than Everest.
Kangchenjunga’s eastern-Nepal logistics and lower traffic mean fewer climbers, fewer parallel commercial systems and less routine infrastructure to absorb setbacks.
The same route can produce very different seasons.
Snow loading, ice, wind and summit-window timing change the practical difficulty. That is why a whole-history 39.0% ratio cannot forecast one particular spring.
Recent seasons show why a lifetime average needs current context
The historical rate stays anchored to the full database. Current season lists are better for understanding what actually happened in individual modern years.
A large summit wave still included a death high on the mountain.
The Himalayan Database Spring 2023 list records numerous Kangchenjunga ascents on May 18 and May 25. Its death list records German climber Luis Andreas Stitzinger at approximately 8,400 metres on May 25.
That one season illustrates why summit counts and fatalities have to be read together rather than turned into one simplistic adjective such as “safe” or “deadly.”
The summit calendar can stretch into June.
The 2024 Himalayan Database ascent list records Kangchenjunga summits on May 27 and again on June 8. That matters because fixed statements such as “the summit window is always May 10–25” are too rigid for a mountain whose actual weather window moves by season.
Modern commercial teams again produced multiple ascents.
The 2025 HDB ascent list records a substantial May summit wave, including climbers and high-altitude staff. The death list also records Margareta Morin of France at approximately 7,800 metres on May 10.
Recent seasons should update context, not overwrite the historical denominator.
A single strong or weak year can make an operator or route percentage look dramatic. The 39.0% figure remains the historical baseline; current seasons tell you whether the present route environment resembles or departs from that long record.

1955 and 2025 belong in one archive—but they are not the same expedition environment.
Better weather information, communications, high-altitude support and equipment have changed expedition practice. At the same time, glacier geometry, snow patterns and route condition continue to evolve. The historical rate summarizes outcomes across those changes rather than controlling for them.

The dataset tells us the outcome; route history explains the mechanisms
Unsupported percentages for turnaround causes are avoided here. The factors below are structural reasons, not a fabricated pie chart.
Small summit windows punish slow positioning.
High wind, snowfall and poor visibility can stop a team before the summit push or make the upper route too slow to justify continuing.
Route condition changes the technical workload.
Heavy snow raises avalanche and trail-breaking problems; lean or icy terrain can expose harder mixed climbing and make fixed-line work slower.
8,586 metres leaves little reserve.
Acclimatization failure, HACE/HAPE symptoms, poor sleep, dehydration and cumulative expedition fatigue can end an attempt even when the route is fixed.
Slow systems compound above 7,500 metres.
Crampon movement, rope transitions and steep mixed sections consume time and oxygen. A technically manageable route can become impractical if the team cannot move efficiently.
Remoteness reduces the ability to reset quickly.
Equipment problems, illness, staffing changes or delays are harder to solve on a remote expedition than on a highly trafficked mountain with dense commercial infrastructure.
A turnaround is not a statistical failure.
The denominator counts outcomes; it does not measure whether a climber made the right decision. Turning around before weather, altitude or route condition removes the margin can be the successful decision.
Three numbers that must never be collapsed into one “death rate”
Kangchenjunga is a strong example of why mountaineering statistics need a denominator printed beside every percentage.
| Calculation | Kangchenjunga | What it can tell you | What it cannot tell you |
|---|---|---|---|
| Deaths / members | 54 / 1,749 = 3.09% | Historical deaths relative to the HDB member-record population. | Your personal probability of death on a future expedition. |
| Deaths / summits | 54 / 682 = 7.92% | Legacy severity comparison against the number of summit records. | Deaths among people who attempted; summit records are not attempts. |
| Summits / members | 682 / 1,749 = 39.0% | Historical summit outcome across the member-record population. | A personalized forecast or guide-company performance rate. |

The mountain is seen from India—but most modern climbing statistics come through Nepal-side expedition records.
The massif dominates views from Sikkim and Darjeeling while the standard climbing line is recorded by the Himalayan Database as the Southwest Face. Geographic visibility and climbing access are therefore not the same thing.

1955: where the Kangchenjunga success archive begins
The first ascent matters statistically and culturally because the successful climbers deliberately stopped just short of the highest point.
Joe Brown and George Band made the first ascent.
Charles Evans led the British expedition up the Yalung / Southwest Face system. Brown and Band reached the summit area on May 25; Norman Hardie and Tony Streather followed on May 26.
George Band’s contemporary Alpine Journal account and later Himalayan Journal summaries describe the expedition’s difficult icefall, high camps and oxygen use.
They kept the highest point untrodden.
The climbers honored a request connected to the mountain’s sacred status by stopping a few feet below the true top. Later accounts describe Hardie and Streather doing the same the next day.
This creates a useful reminder for modern data work: “summit” is not always a purely geometric concept. Historical records reflect the standards and cultural agreements of their era.

A mountain visible far beyond the climbing side
Kangchenjunga from Darjeeling, 1992 · EJH · public domain. Source.


The Nepal-side landscape is part of the expedition story
Kanchenjunga Conservation Area from the Pathivara trekking region · Nikeshparajuli · CC BY-SA 4.0.

Use 39.0% as a research baseline—not a booking forecast
The strongest planning decisions come from asking which variables the historical average hides.
What is your own denominator?
If an operator advertises an 80% or 90% success rate, ask whether the denominator is clients who left home, clients who reached base camp, summit-team members, or summit pushes. Without that definition the number is marketing, not data.
What happened on this route last year?
Historical averages cannot tell you whether the upper mountain is currently icy, heavily loaded, late to be fixed, or experiencing an unusual weather pattern.
What exactly changes above base camp?
Oxygen strategy, rope fixing, high-altitude staff ratio, camp placement and communications can alter the practical expedition system even when the mountain is unchanged.
Can you move efficiently on steep mixed terrain while hypoxic?
Prior altitude exposure alone is not the full test. Kangchenjunga also asks for technical efficiency, descent durability and judgment after weeks on expedition.
What decisions are made before summit day?
A good expedition defines weather, oxygen, pace and medical limits before ambition and sunk cost begin influencing the call.
Do not force precision where the database cannot support it.
Route-specific, experience-specific and support-specific outcome rates may be valuable research targets, but they should not be published as exact percentages until the subsets can be reproduced.
Kangchenjunga’s outcome statistics sit inside a long, remote expedition system.
Access, staffing, supply chains and evacuation planning all influence how much margin a team has when conditions deteriorate. That context belongs beside the summit rate even though it cannot be reduced to one clean percentage.
How this success-rate page is maintained
Primary database records own the numbers. Expedition journals and current season lists explain the route and the individual seasons.
Himalayan Database — core archive
The Himalayan Database is the primary expedition archive used for Kangchenjunga member, summit and death records. Its search system allows filtering by peak, season, member status, success and death fields.
HDB-derived 8,000m comparison
The current machine-readable comparison used for the page’s headline totals records Kangchenjunga at 1,749 members, 682 summits and 54 deaths through 2025.
Standard-route definition
The Himalayan Database analysis appendix lists the Southwest Face as Kangchenjunga’s standard 8,000m route. Historical AAJ normal-route reports also describe the Southwest Face / Yalung-side expedition line.
Recent season lists
HDB’s official interim lists are used to ground the recent-season section rather than extrapolating an annual success percentage from operator reports.
First-ascent history
George Band’s 1955 Alpine Journal account is the primary historical source for the first ascent. The American Alpine Journal and Himalayan Journal provide additional contemporary and retrospective context.
Calculation rules
Global Summit Guide calculates only ratios that can be reproduced from the published totals. Numbers are rounded to two decimal places for death metrics and one decimal place for summit/member. No subgroup percentage is published unless its population and numerator can be audited.
Kangchenjunga summit success rate FAQ
The visible answers below match the structured FAQ data.
What is the Kangchenjunga summit success rate?
Using the Himalayan Database historical member-record population through 2025, Kangchenjunga has 682 summit records from 1,749 member records. That equals a 39.0% summit/member ratio. It is a historical ratio, not a personalized probability for a future climber.
How many people have summited Kangchenjunga?
The dataset records 682 summit records through 2025. Because repeat climbers can create more than one summit record, that should not automatically be rewritten as 682 unique people.
How many deaths are recorded on Kangchenjunga?
The same comparison dataset records 54 deaths associated with Kangchenjunga member records through 2025.
What is Kangchenjunga’s death rate?
It depends on the denominator. Deaths/member is 54 ÷ 1,749 = 3.09%. Deaths/summits is 54 ÷ 682 = 7.92%. Those statistics answer different questions and neither should be described as a personal attempt-fatality probability.
Is Kangchenjunga more dangerous than Annapurna or Dhaulagiri?
Not by every metric. In the same HDB comparison, Kangchenjunga has 3.09% deaths/member, Dhaulagiri I 3.07% and Annapurna I 3.64%. Deaths/summits are 7.92%, 13.03% and 13.46% respectively. A ranking changes when the denominator changes.
What is the normal route?
The Himalayan Database identifies the Southwest Face as Kangchenjunga’s standard 8,000-metre route. Most modern Nepal-side expeditions use the Yalung approach and variations of the historical southwest route system.
When was Kangchenjunga first climbed?
Joe Brown and George Band made the first ascent on May 25, 1955. Norman Hardie and Tony Streather followed the next day. The climbers stopped just short of the highest point out of respect for the mountain’s sacred status.
Why isn’t 39.0% my personal chance of summiting?
The number combines decades of climbers, routes, support systems, oxygen strategies, weather and expedition practices. Your actual outcome depends on variables the historical ratio does not isolate.
Where is Kangchenjunga?
Kangchenjunga rises to 8,586 metres on the Nepal–India border in the eastern Himalaya, between Taplejung in Nepal and Sikkim in India.
39.0% is a strong historical baseline—because we can show exactly where it comes from.
Kangchenjunga’s record is 682 summit records from 1,749 member records through 2025. Keep that denominator attached, separate fatality metrics from summit metrics, and use current route conditions to decide what the historical average does—and does not—mean for the expedition in front of you.
Compare Summit Success RatesRoutes, risk, cost & comparable 8,000-metre data
This page owns the summit/member denominator. The pages below own the broader mountain plan, route choice, cost, risk comparisons and the decision tools that should not be compressed into one success-rate article.
This peak is one of the 14 mountains on Earth above 8,000 meters
The 14 eight-thousanders are the only mountains on Earth that rise above 8,000m — the altitude where the human body enters the Death Zone. See the complete collection ranked by elevation, with death rates, first ascent history, and the Messner/Kukuczka/Nims Purja completion records.
View All 14 Eight-Thousanders →🏔 Part of the 14 Eight-Thousanders
One of the 14 mountains on Earth above 8,000m. See the complete collection with death rates, first ascents, and the 14 Peaks Challenge history.
View All 14 Eight-Thousanders →Was this helpful?
🏔Related safety data
🧭Explore & compare
Global Summit Guide is an independent mountaineering resource founded in 2026. The team combines first-hand trekking and climbing experience with in-depth research and professional health and nutrition review to help climbers choose objectives, prepare properly, and stay safe.
Health, altitude, and nutrition content is reviewed by Taylor Ludlow (Registered Nurse) and Brigg Hoopes (Nutritionist).
What We Don't Know Yet
Mountain information changes quickly. This box explains the limits of what this page can responsibly promise.
- Visa, passport, vaccination, border, insurance, and local transportation rules may change before your trip.
- Route conditions, snowpack, closures, and weather can change quickly after this page is updated.
- Permit rules, fees, quotas, and reservation windows may change between review cycles.
- Operator availability, pricing, guide ratios, and cancellation terms can change by season.
- Your fitness, altitude response, risk tolerance, and experience level may change what is safe or realistic.
Verify current conditions with official land managers, guide services, local forecasts, and current route reports before booking or climbing.
Mountaineering, rock and ice climbing, glacier travel, and high-altitude activity are inherently dangerous and can result in serious injury or death. The information on Global Summit Guide is provided for general informational and educational purposes only and is not a substitute for professional instruction, qualified guiding, proper equipment, or your own judgment and experience.
Route conditions, weather, snowpack, permits, regulations, and hazards change constantly and may differ from what is described here. Details may be incomplete, out of date, or contain errors. Always verify current information with local authorities, certified guides, and official sources before making any decision in the mountains.
Nothing on this site is medical, legal, or financial advice. Our fitness, acclimatization, altitude, and nutrition content is general in nature; consult a qualified physician before beginning any strenuous exercise program or exposing yourself to high altitude.
You are solely responsible for your own safety and decisions. To the fullest extent permitted by law, Global Summit Guide and its team accept no liability for any loss, injury, damage, or expense arising from use of, or reliance on, this information. By using this site you acknowledge these risks and accept these terms.
Some links on this site may be affiliate links. If you buy through them we may earn a small commission at no extra cost to you; this never affects our recommendations.
Global Summit Guide recommendation path
Next Best Mountain to Research
Use these recommendations to continue the right planning path instead of stopping on one page.
Use current permit, weather, route, and operator information before booking or climbing.