Most Dangerous Mountains in the World: Annapurna, K2 & the Top 10 Ranked
Annapurna I is the clearest answer when “most dangerous” means a high published death-to-ascent ratio among major Himalayan peaks. Guinness World Records currently lists Annapurna at 13.42%, narrowly ahead of Dhaulagiri at 13.01%. K2 remains the strongest overlap of extreme technical difficulty and severe objective hazard, with Global Summit Guide’s closed-through-2025 death-to-summit ratio at 9.54%.
Reviewed August 15, 2026 · Annapurna/Dhaulagiri current comparison anchored to Guinness/Himalayan Database · K2 dataset closed through 2025
What is the most dangerous mountain in the world?
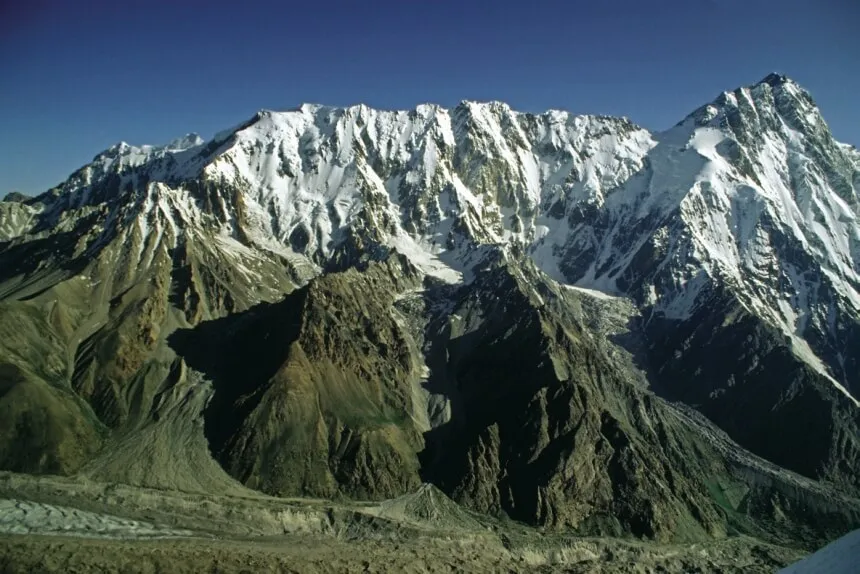
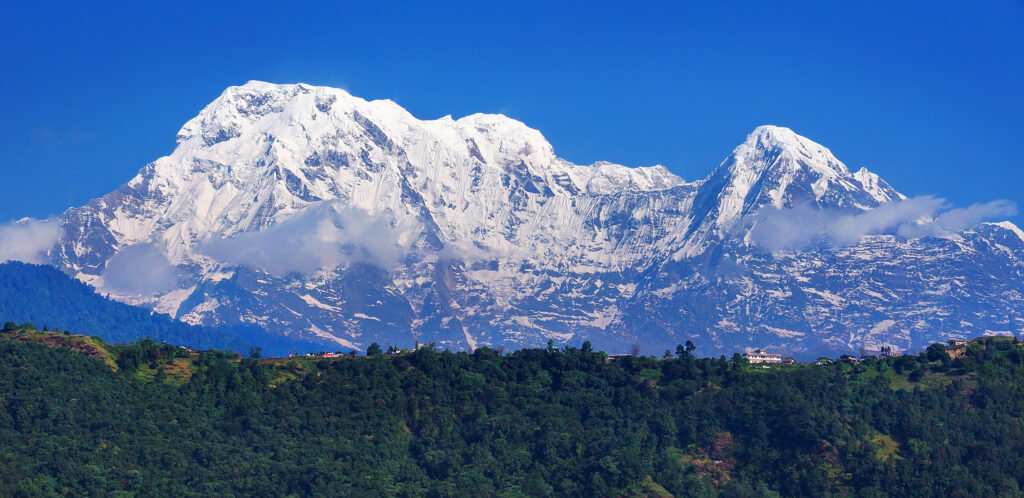
If “most dangerous” means the highest newer published death-to-ascent ratio among the major Nepal Himalayan 8,000ers, Annapurna I leads at 13.42%: 75 fatalities from 559 recorded ascents in the current Guinness World Records entry. Dhaulagiri is almost tied at 13.01%.
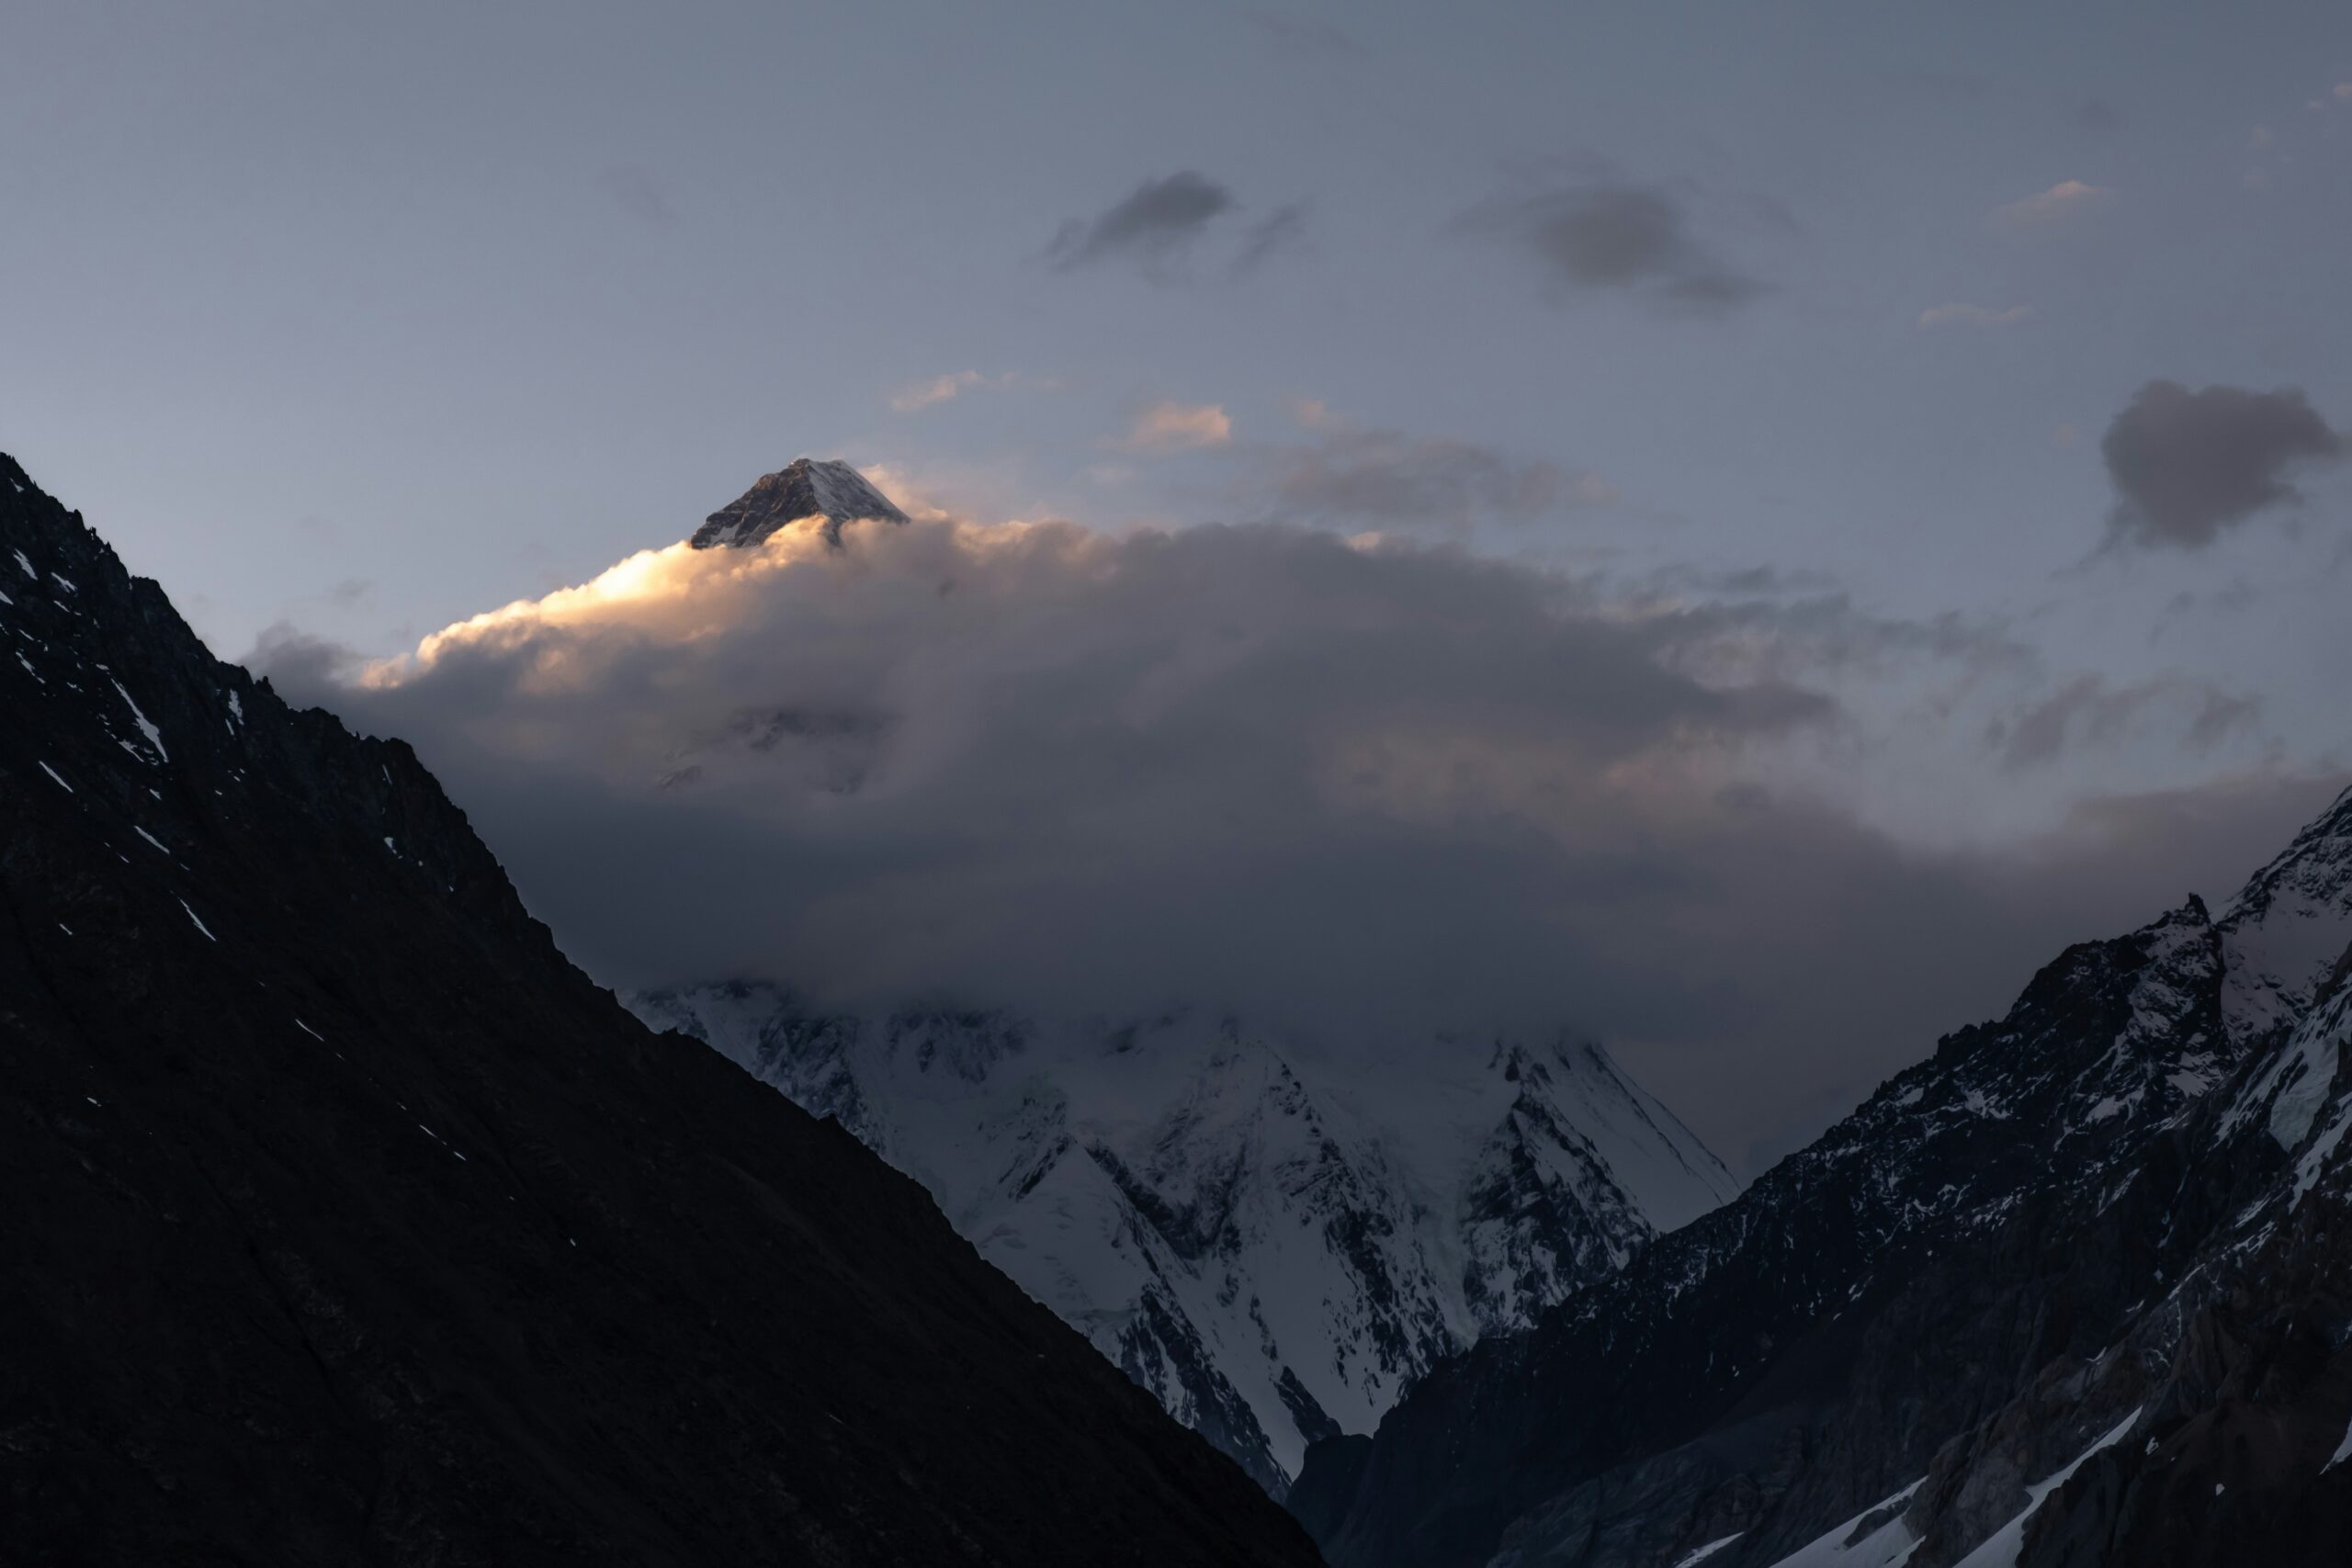
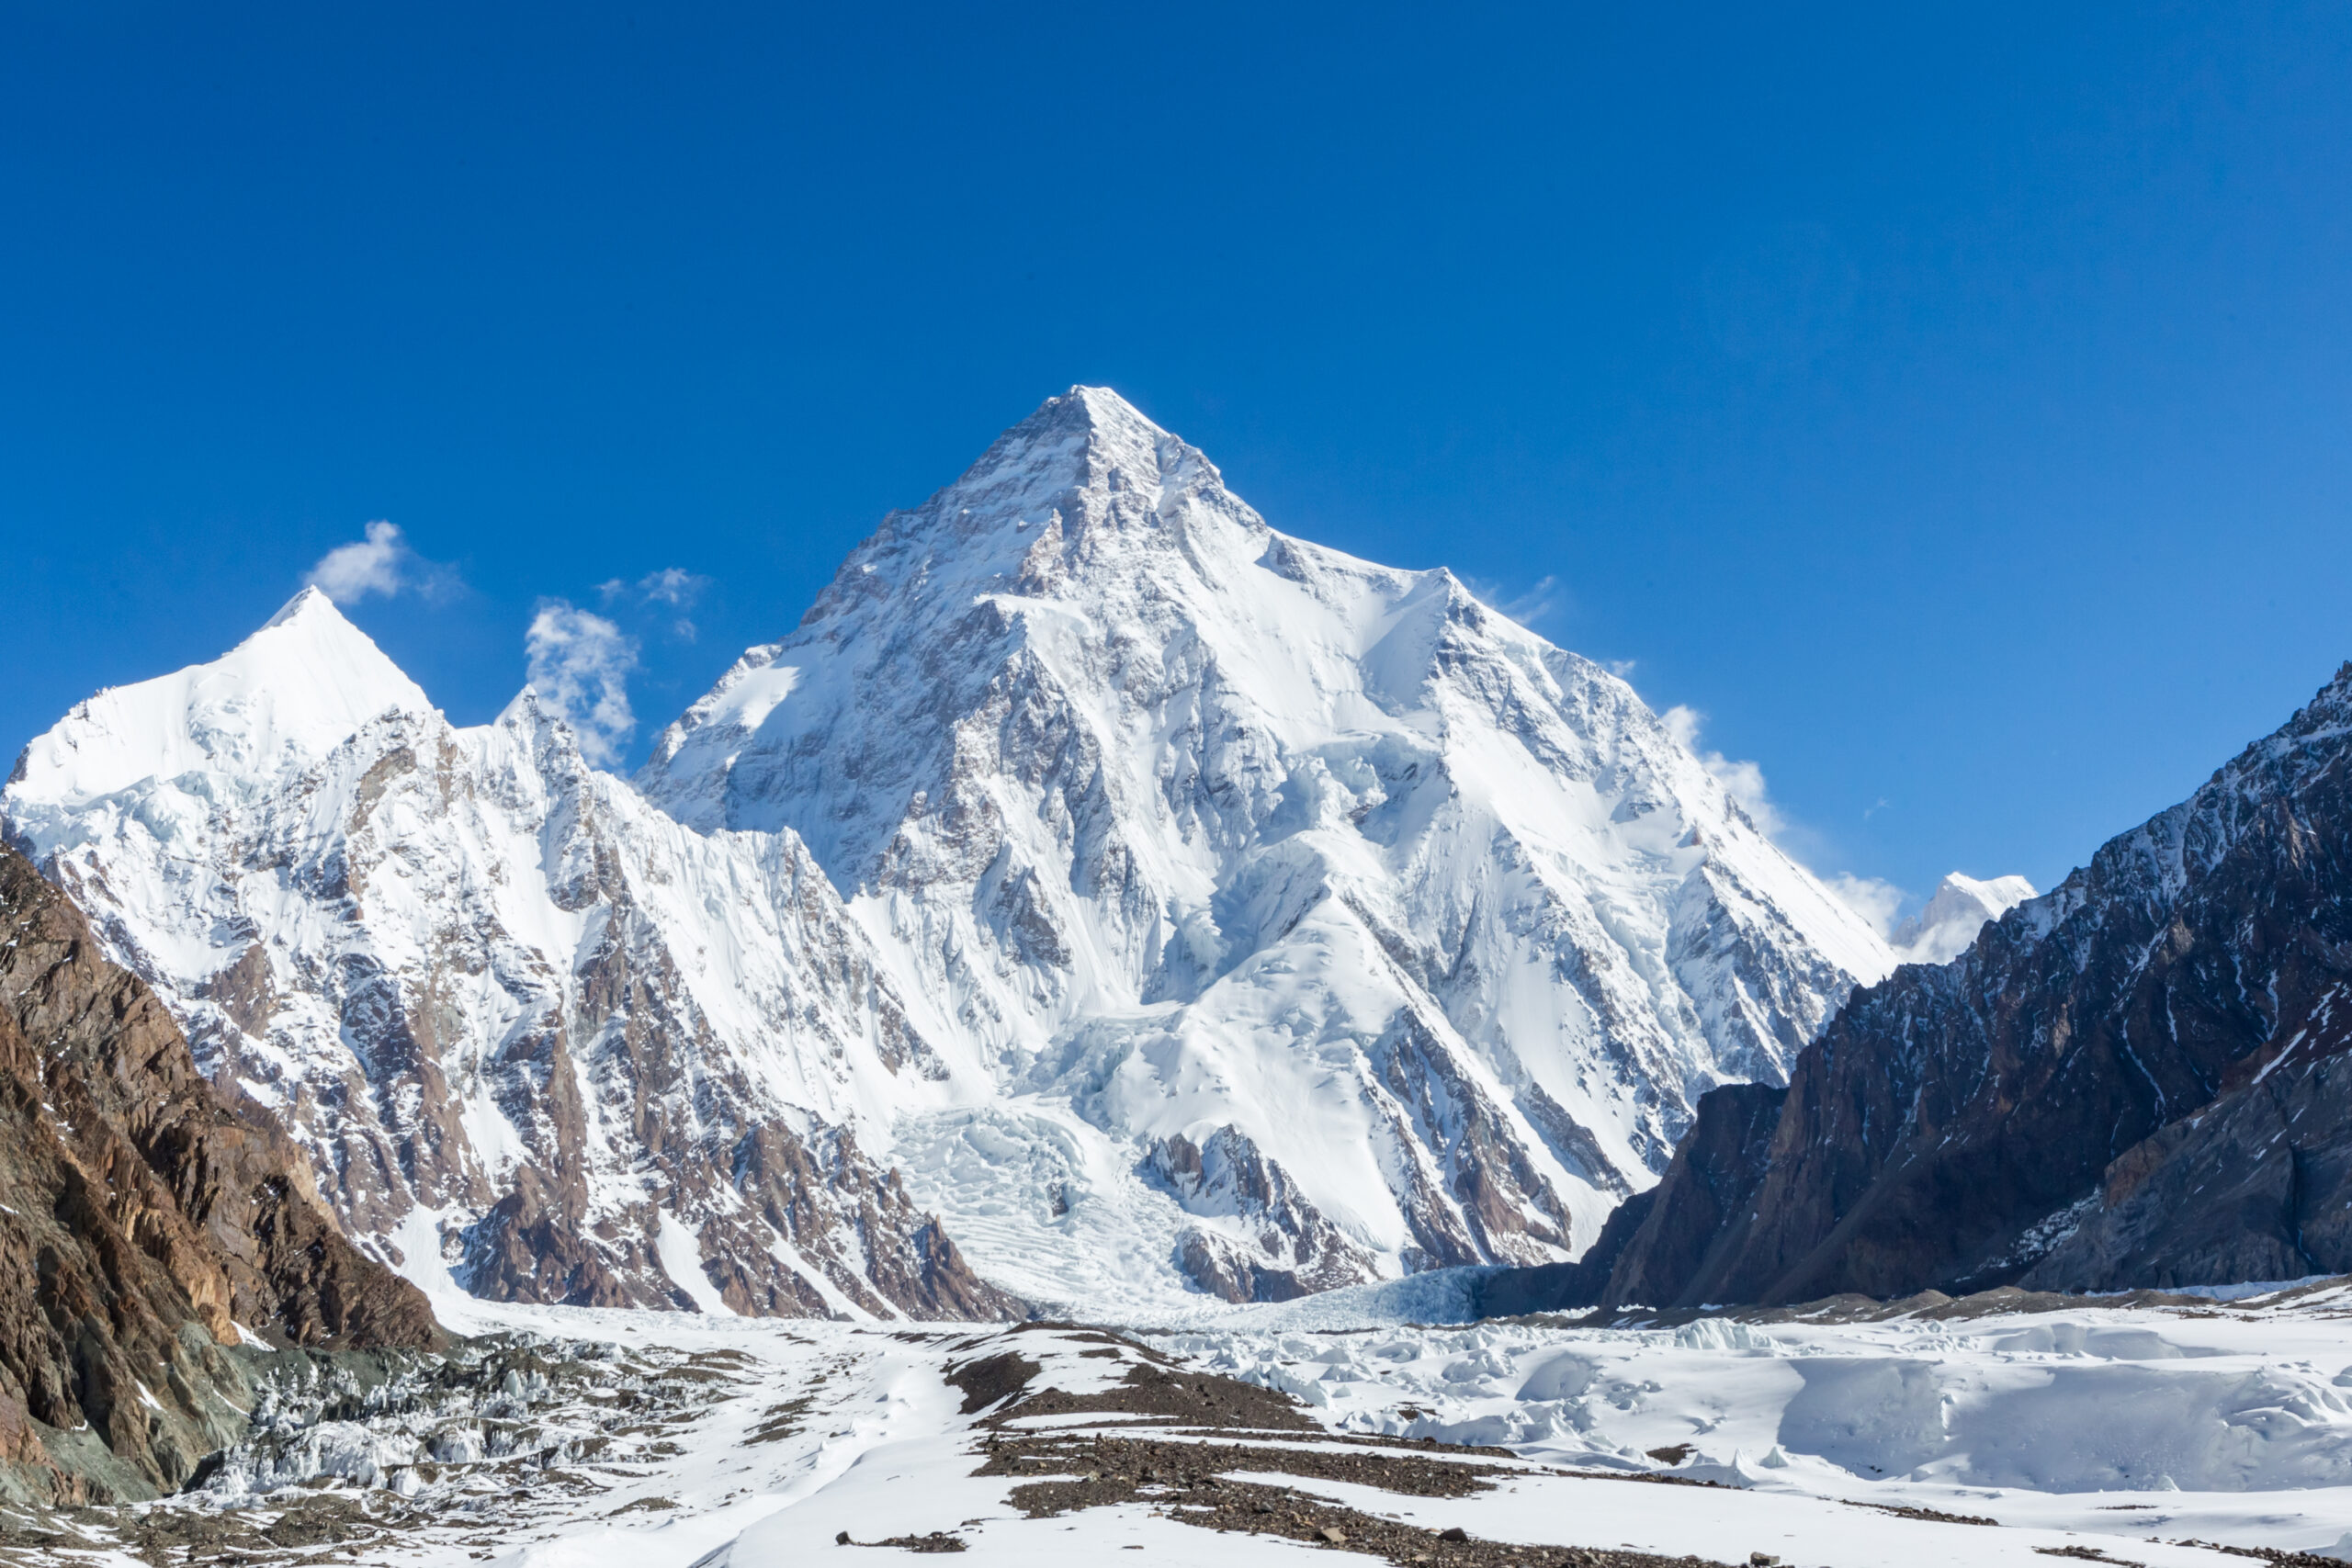
If “most dangerous” means the mountain that best combines technical difficulty, extreme altitude, objective hazard, weak rescue margin and a high cumulative fatality ratio, K2 is the stronger answer. Global Summit Guide’s closed-through-2025 K2 compilation gives 92 deaths / 964 summits = 9.54%.
- Highest newer published Nepal-Himalaya ratio: Annapurna I — 13.42%.
- Very close second in same dataset: Dhaulagiri I — 13.01%.
- Danger + technical difficulty: K2.
- Largest broad historical toll: Mont Blanc is frequently cited, but exact all-history counts are uncertain.
- Highest traffic among 8,000ers: Everest, which changes the meaning of absolute deaths vs percentage risk.
What Does “Most Dangerous Mountain” Mean?
A mountain can lead one metric and rank far lower on another. The definition has to come before the ranking.
Death-to-Ascent / Summit Ratio
Fatalities divided by recorded successful ascents or summits. Useful for historical severity relative to summit volume, but not personal attempt probability.
Absolute Death Toll
Total recorded fatalities. High-volume mountains can accumulate a large toll despite a lower percentage ratio.
Objective Hazard
Avalanche, serac collapse, rockfall, storms and terrain exposure that climbers cannot completely control.
Technical + Rescue Severity
Steep climbing, altitude, commitment, difficult retreat, weak rescue capacity and thin infrastructure stacked together.
This page owns the ranking question—not the complete database.
For the full cross-mountain statistical framework, denominators, methods and larger comparison table, use Death Rates by Mountain.
Top 10 Most Dangerous Mountains in the World
This ranking is not a single mathematical league table. It combines defensible fatality evidence with objective hazard, technical seriousness, altitude, retreat and rescue margin.
| # | Mountain | Why it ranks here | Current / historical context | Primary hazard |
|---|---|---|---|---|
| 1 | Annapurna I | Highest newer published Nepal-Himalaya ratio plus major avalanche exposure | 13.42% published; historic shorthand ~27–32% | Avalanche, serac, altitude |
| 2 | K2 | Strongest combination of technical difficulty, objective hazard and weak rescue margin | 9.54% GSG closed-through-2025; historic shorthand ~22–25% | Bottleneck serac, falls, storms, descent |
| 3 | Dhaulagiri I | Nearly tied with Annapurna in the current Guinness Nepal-Himalaya ratio | 13.01% in the same published dataset | Avalanche, weather, exposed upper mountain |
| 4 | Nanga Parbat | Historically lethal early expeditions, huge relief and committing retreat | High historical risk band; current figures vary by source | Avalanche, storms, large faces |
| 5 | Kangchenjunga | Remote 8,000er with severe weather and limited rescue margin | 7.83% in current Guinness Nepal-Himalaya table | Weather, falls, remoteness |
| 6 | Makalu | Technical summit pyramid, extreme altitude and thinner support system | 5.72% in current Guinness Nepal-Himalaya table | Technical terrain, altitude, weather |
| 7 | Denali | Arctic cold, storms, crevasses and self-supported logistics amplify consequence | Official NPS incident reporting is more useful than one frozen global ratio | Cold, storms, crevasses, falls |
| 8 | Matterhorn | Moderate technical grade can become lethal through speed, route-finding, congestion and descent | Large cumulative Alpine toll; ratio depends heavily on denominator | Falls, rockfall, descent, storms |
| 9 | Mount Everest | Extreme altitude, icefall and huge exposure volume produce a large absolute death count | 2.50% in current Guinness Nepal-Himalaya comparison | Altitude, icefall, exhaustion, weather |
| 10 | Cerro Torre | Elite technical difficulty and severe Patagonian weather despite weak statistical denominator | Not assigned a false precise fatality percentage | Weather, rime ice, technical retreat |
Why Dhaulagiri moves up in this rebuild
The current Guinness/Himalayan Database comparison lists Dhaulagiri at 13.01%, almost tied with Annapurna’s 13.42%. A ranking that uses newer data cannot keep Dhaulagiri buried beneath several mountains simply because older historical shorthand is more famous.
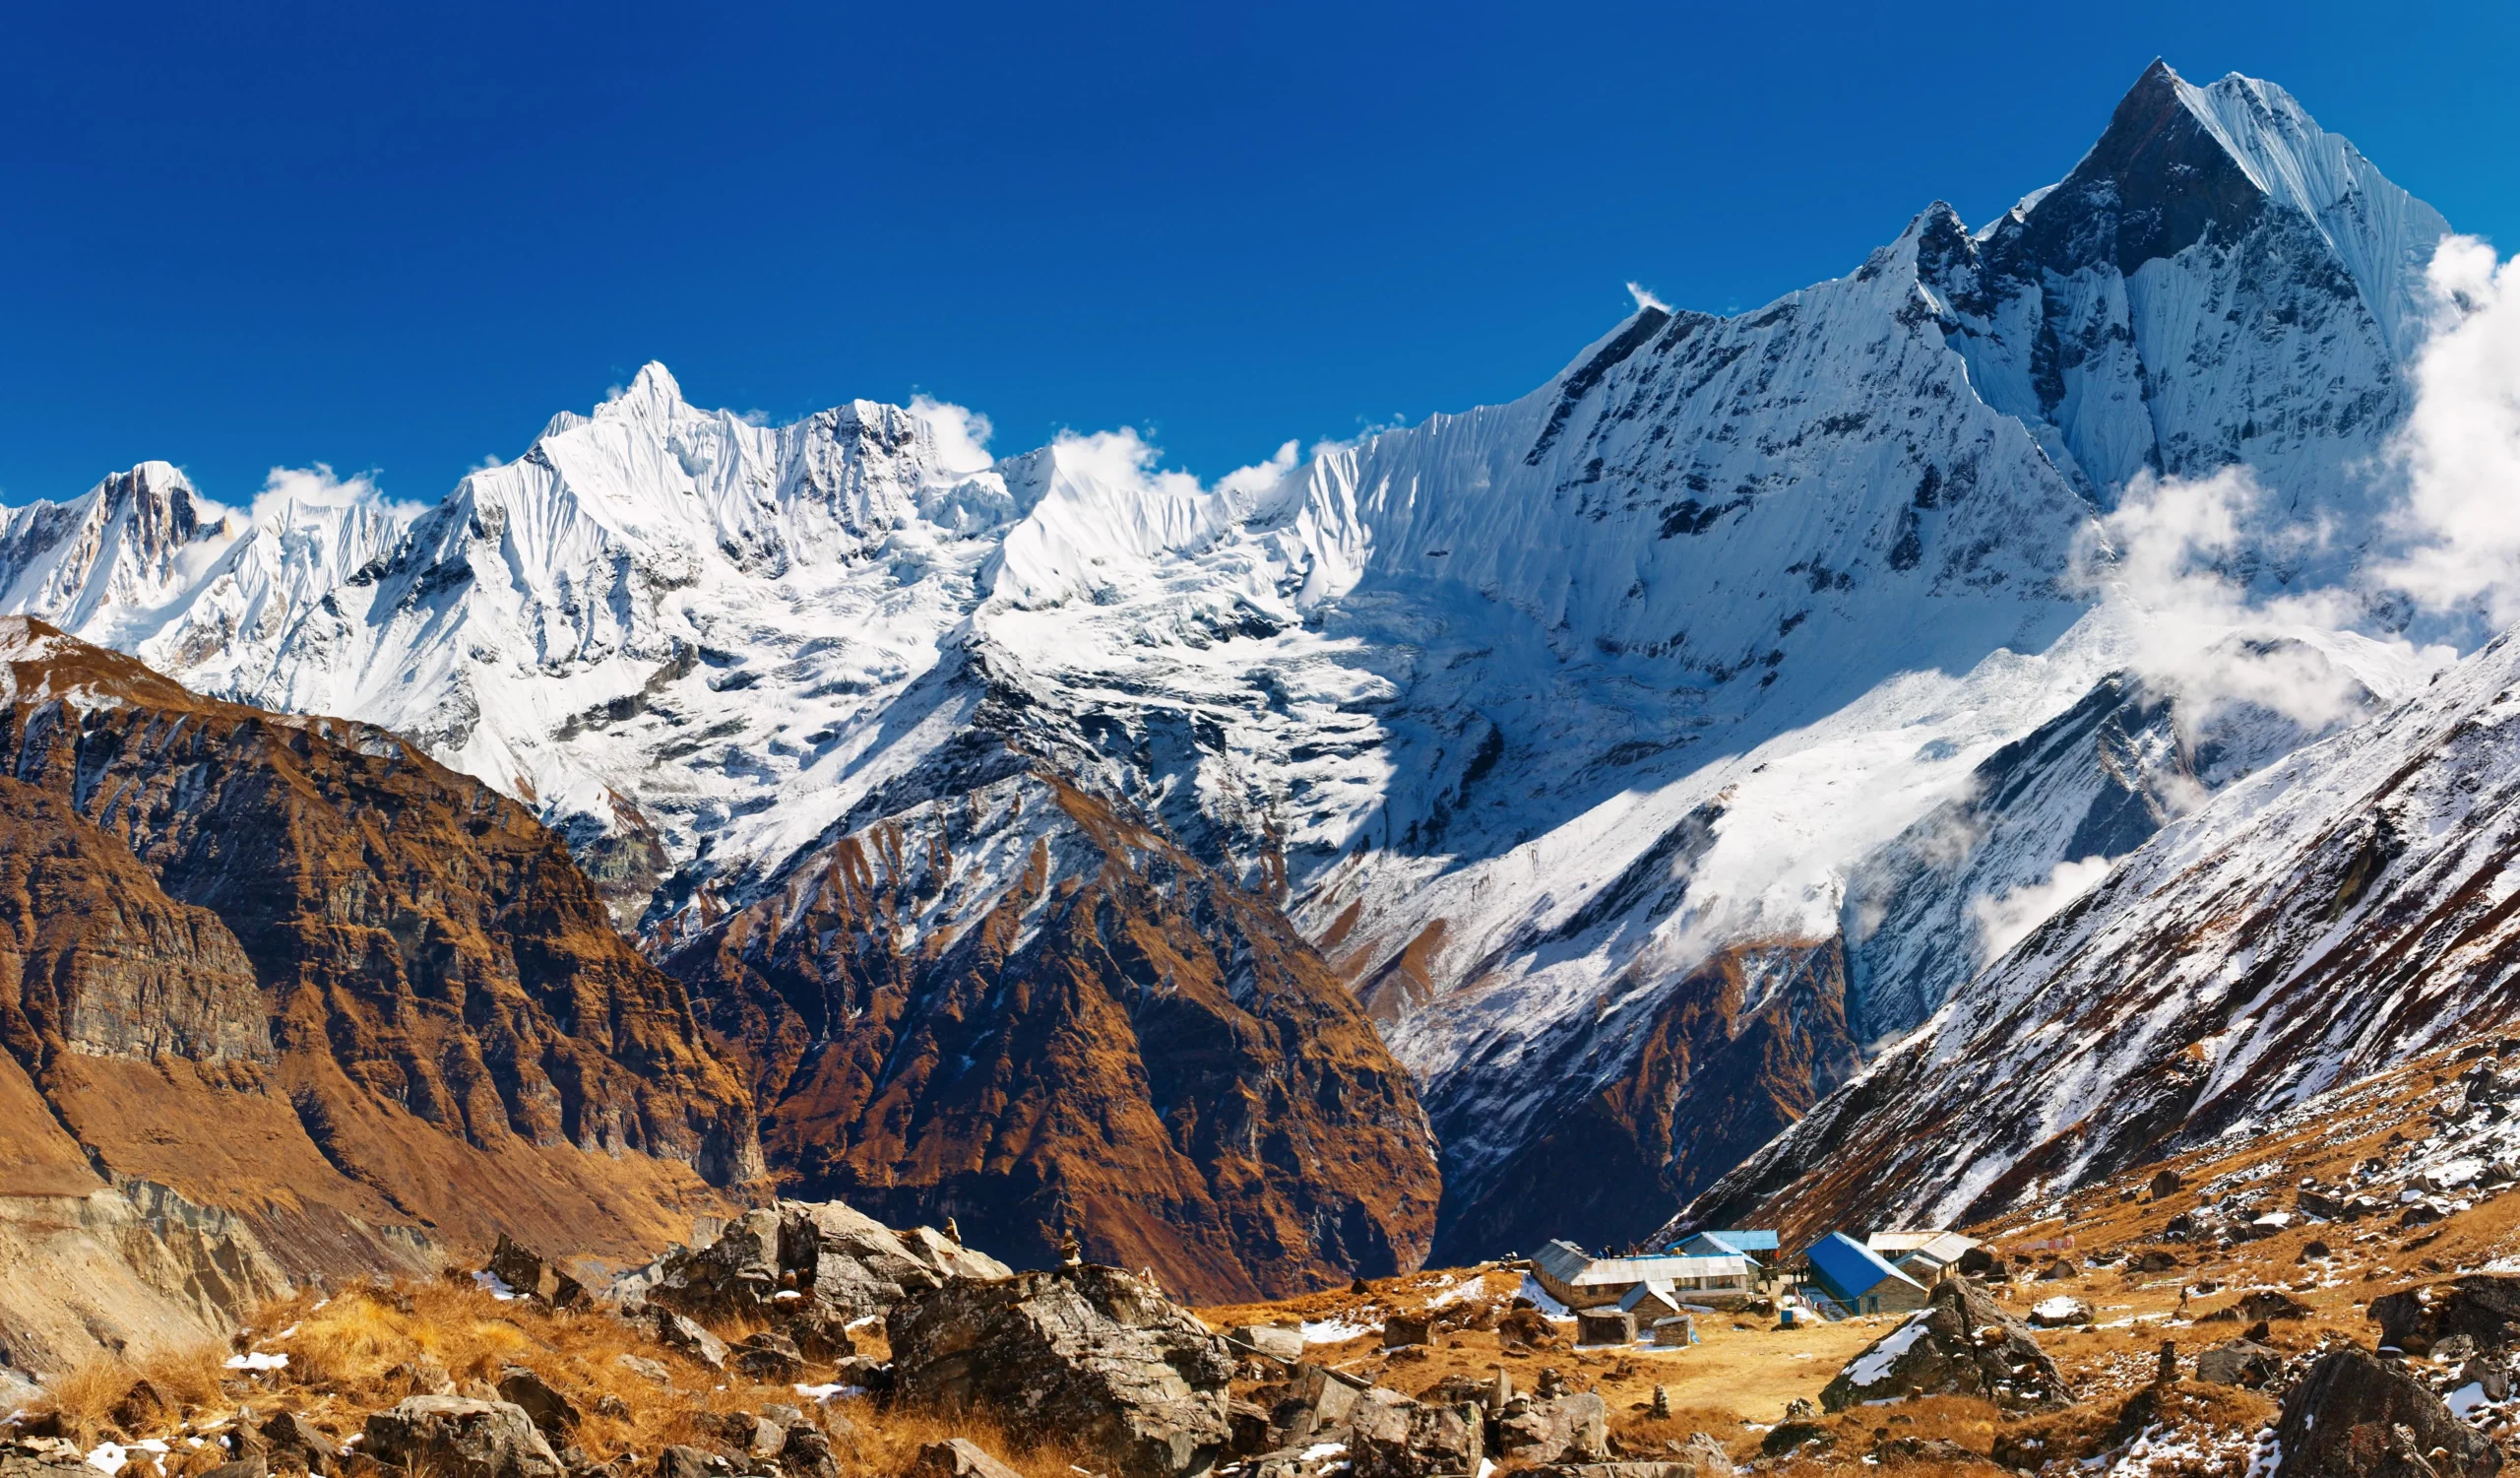
Annapurna is #1—but Dhaulagiri is nearly tied.
Guinness World Records, citing Himalayan Database figures, lists Annapurna I at 13.42% and Dhaulagiri I at 13.01%. That is a much more useful current comparison than repeating decades-old 30% and 20% shorthand without a date.
Current Published Ratios for the Nepal Himalayan 8,000ers
These eight rows come from the same Guinness/Himalayan Database comparison, making them more directly comparable with one another.
| Mountain | Deaths | Recorded climbs / ascents | Published ratio | Interpretation |
|---|---|---|---|---|
| Annapurna I | 75 | 559 | 13.42% | Highest in current Guinness Nepal-Himalaya comparison |
| Dhaulagiri I | 92 | 707 | 13.01% | Nearly tied with Annapurna |
| Kangchenjunga | 54 | 690 | 7.83% | Still a very high published ratio |
| Makalu | 51 | 891 | 5.72% | Technical upper mountain with less summit volume |
| Everest | 344 | 13,752 | 2.50% | Huge traffic creates a large absolute toll but much lower ratio |
| Manaslu | 90 | 3,750 | 2.40% | Commercial growth dramatically expanded summit volume |
| Lhotse | 25 | 1,473 | 1.70% | Shared Everest infrastructure changes exposure context |
| Cho Oyu | 52 | 4,081 | 1.27% | Lowest ratio in the cited eight-peak comparison |
Source: Guinness World Records — Deadliest Himalayan Mountain. The record page is dated February 7, 2026 and states its underlying Himalayan Database figures are as of February 7, 2025.
Historical Reputation vs Current Data
The mountain does not need to become easy for the cumulative ratio to fall. The denominator can change dramatically.
Annapurna: ~27–32% → 13.42%
Annapurna’s historic ratio was built during an era of very few successful ascents. The newer published ratio is materially lower because the ascent denominator expanded. Avalanche and serac exposure remain central hazards.
K2: ~22–25% → 9.54% GSG 2025
K2’s famous “one death for every four summits” description is historical. Global Summit Guide’s reconciled closed-through-2025 figure is 92 deaths / 964 successful summits = 9.54%. The technical and objective-hazard profile remains severe.
Historical numbers are not useless—they are just historical.
They explain why Annapurna, K2, Nanga Parbat and Dhaulagiri developed their reputations. They should not be presented as if the climbing population froze decades ago.
Why the Most Dangerous Mountains Kill Climbers
High fatality ratios can come from very different risk systems.
Annapurna I
Avalanche and serac exposure dominate the danger profile. Guinness identifies a major fatality concentration around 5,900 m between Camps II and III.
K2
Steep mixed climbing, the Bottleneck beneath hanging ice, extreme altitude, unstable weather and a committing descent stack together.
Dhaulagiri I
Avalanche exposure, storms and a less forgiving expedition ecosystem create a current ratio almost identical to Annapurna in the cited dataset.
Nanga Parbat
Huge faces, avalanche terrain, western-Himalaya storms and difficult retreat shaped one of mountaineering’s most lethal early histories.
Kangchenjunga
Extreme altitude, remote terrain, poor rescue margin and less commercial redundancy than Everest increase consequence.
Matterhorn
The technical grade is moderate by elite alpine standards, but speed, route-finding, congestion, rockfall and descent fatigue magnify mistakes.
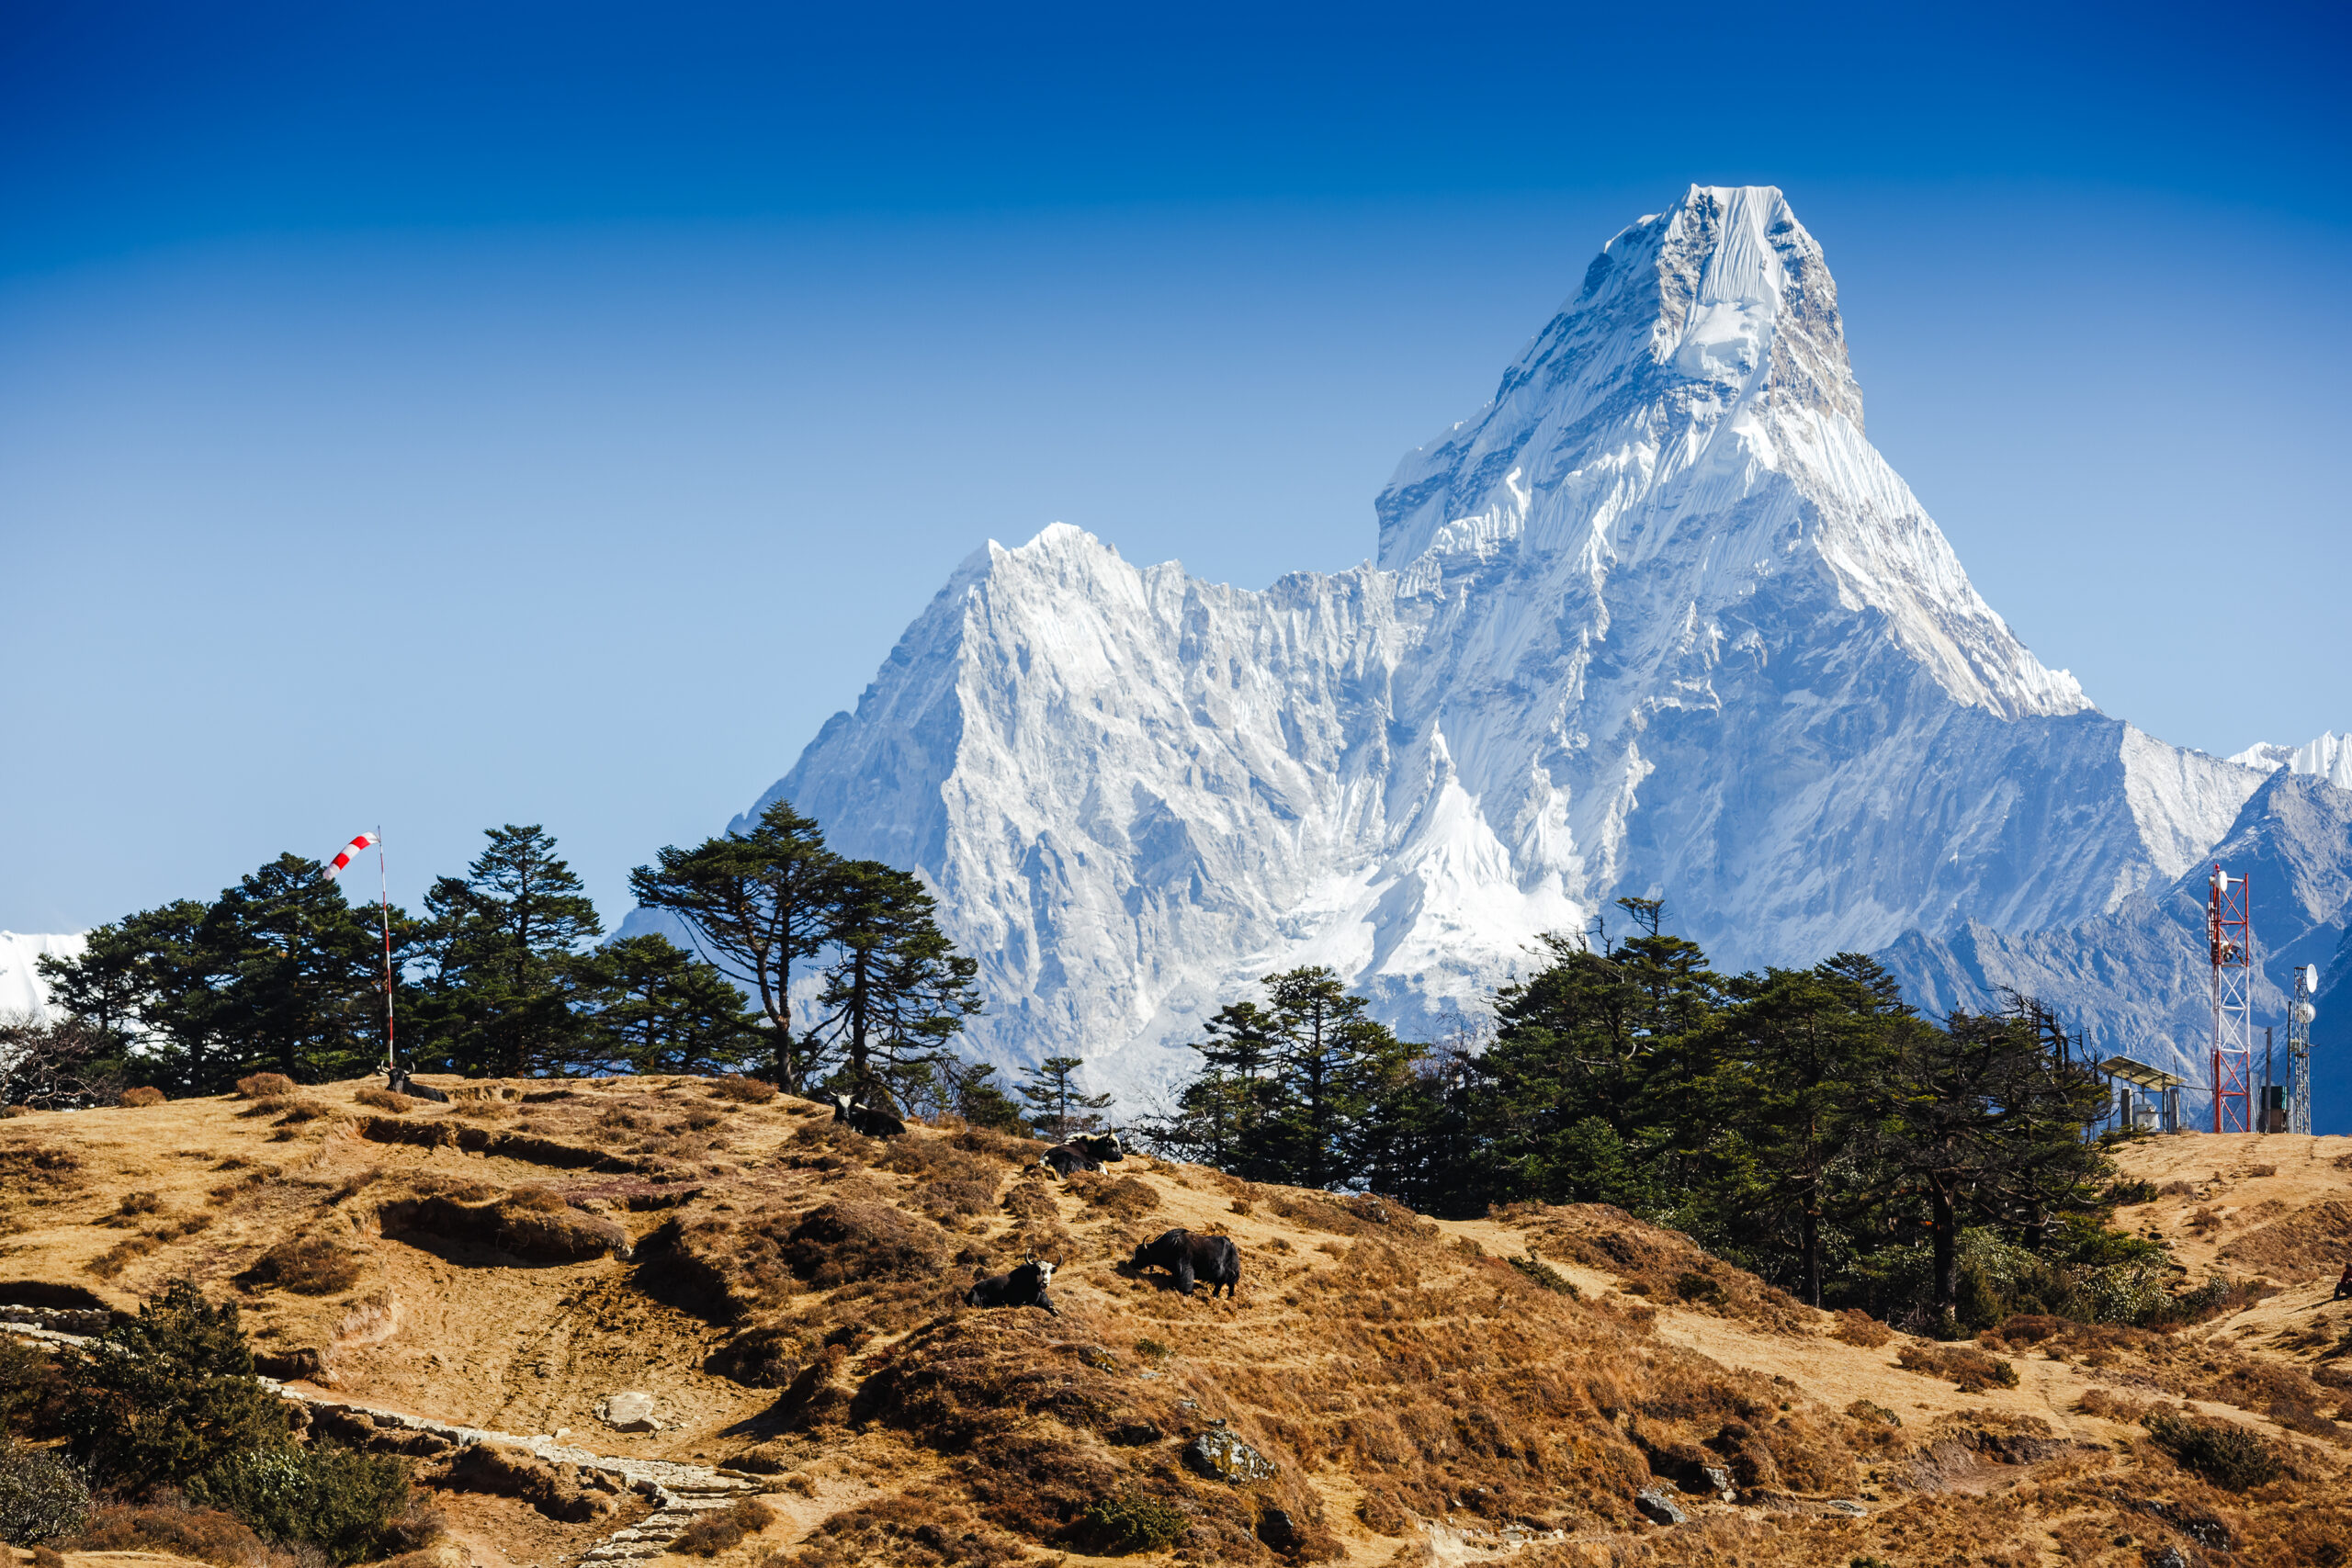
Everest has far more climbing traffic than Annapurna or K2.
That is why Everest can accumulate a very large historical death count while its published deaths-to-ascents ratio remains far lower. Exposure volume and percentage risk answer different questions.
Fatality Rate vs Total Deaths
“Which mountain has the highest death rate?” and “Which mountain has killed the most people?” are not the same search intent.
| Metric | Likely leader / example | Why | Best use |
|---|---|---|---|
| Newer published Nepal-Himalaya ratio | Annapurna I | 13.42% in current Guinness comparison | Same-source modern comparison |
| Danger + technical severity | K2 | Technical climbing + altitude + objective hazard + weak rescue margin | Overall expedition seriousness |
| Broad historical absolute toll | Mont Blanc often cited | Centuries of climbing and enormous participation | Understanding cumulative human toll |
| 8,000er absolute toll | Everest | By far the largest climbing population among the 8,000ers | Traffic-driven cumulative exposure |
Dangerous Mountains We Cannot Rank Cleanly
Low-traffic technical peaks can be exceptionally dangerous without a trustworthy all-history denominator.
Cerro Torre
Patagonian weather, rime ice, technical climbing and difficult retreat make Cerro Torre a severe objective. But a complete historical attempt/summit/fatality denominator is not available, so assigning a precise percentage would create false confidence.
Rare Himalayan Faces & Technical Towers
A rarely attempted face may be more dangerous on a particular route or season than a high-traffic mountain in the Top 10. Without a reliable exposure denominator, it belongs in qualitative risk analysis rather than a fake decimal ranking.
Danger vs Technical Difficulty
Difficulty measures what the climber must do. Danger measures what can happen even when the climber performs well.
| Mountain | Why dangerous | Why difficult | Relationship |
|---|---|---|---|
| K2 | Serac, storms, altitude, descent | Sustained steep technical 8,000m climbing | High on both |
| Annapurna I | Avalanche and serac exposure | Serious high-altitude mountaineering | Objective danger exceeds pure technical grade |
| Cerro Torre | Weather, rime, rock/ice fall, retreat | Elite technical alpinism | High on both; weak statistical denominator |
| Everest | Altitude, icefall, weather, congestion | Physiologically extreme; standard route less technical than K2 | Huge toll, lower percentage ratio |
| Matterhorn | Falls, rockfall, route-finding, storms | Fast exposed alpine scrambling/climbing | Moderate grade, high consequence |
For technical ranking intent, use The 10 Hardest Mountains to Climb and Eight-Thousanders Ranked by Difficulty.
Objective Hazard vs Controllable Risk
You cannot make a dangerous mountain safe. You can reduce avoidable layers of exposure.
Objective Hazards
- Serac collapse
- Large avalanche release
- Rockfall from warming terrain
- Rapid high-altitude storms
- Extreme cold and remoteness
You can reduce exposure time or avoid conditions, but you cannot control the hazard itself.
Controllable Risk
- Progression and experience
- Route and season selection
- Operator / partner quality
- Turnaround discipline
- Acclimatization and fitness
- Equipment and communication
These factors do not remove objective danger, but they can reduce avoidable exposure.
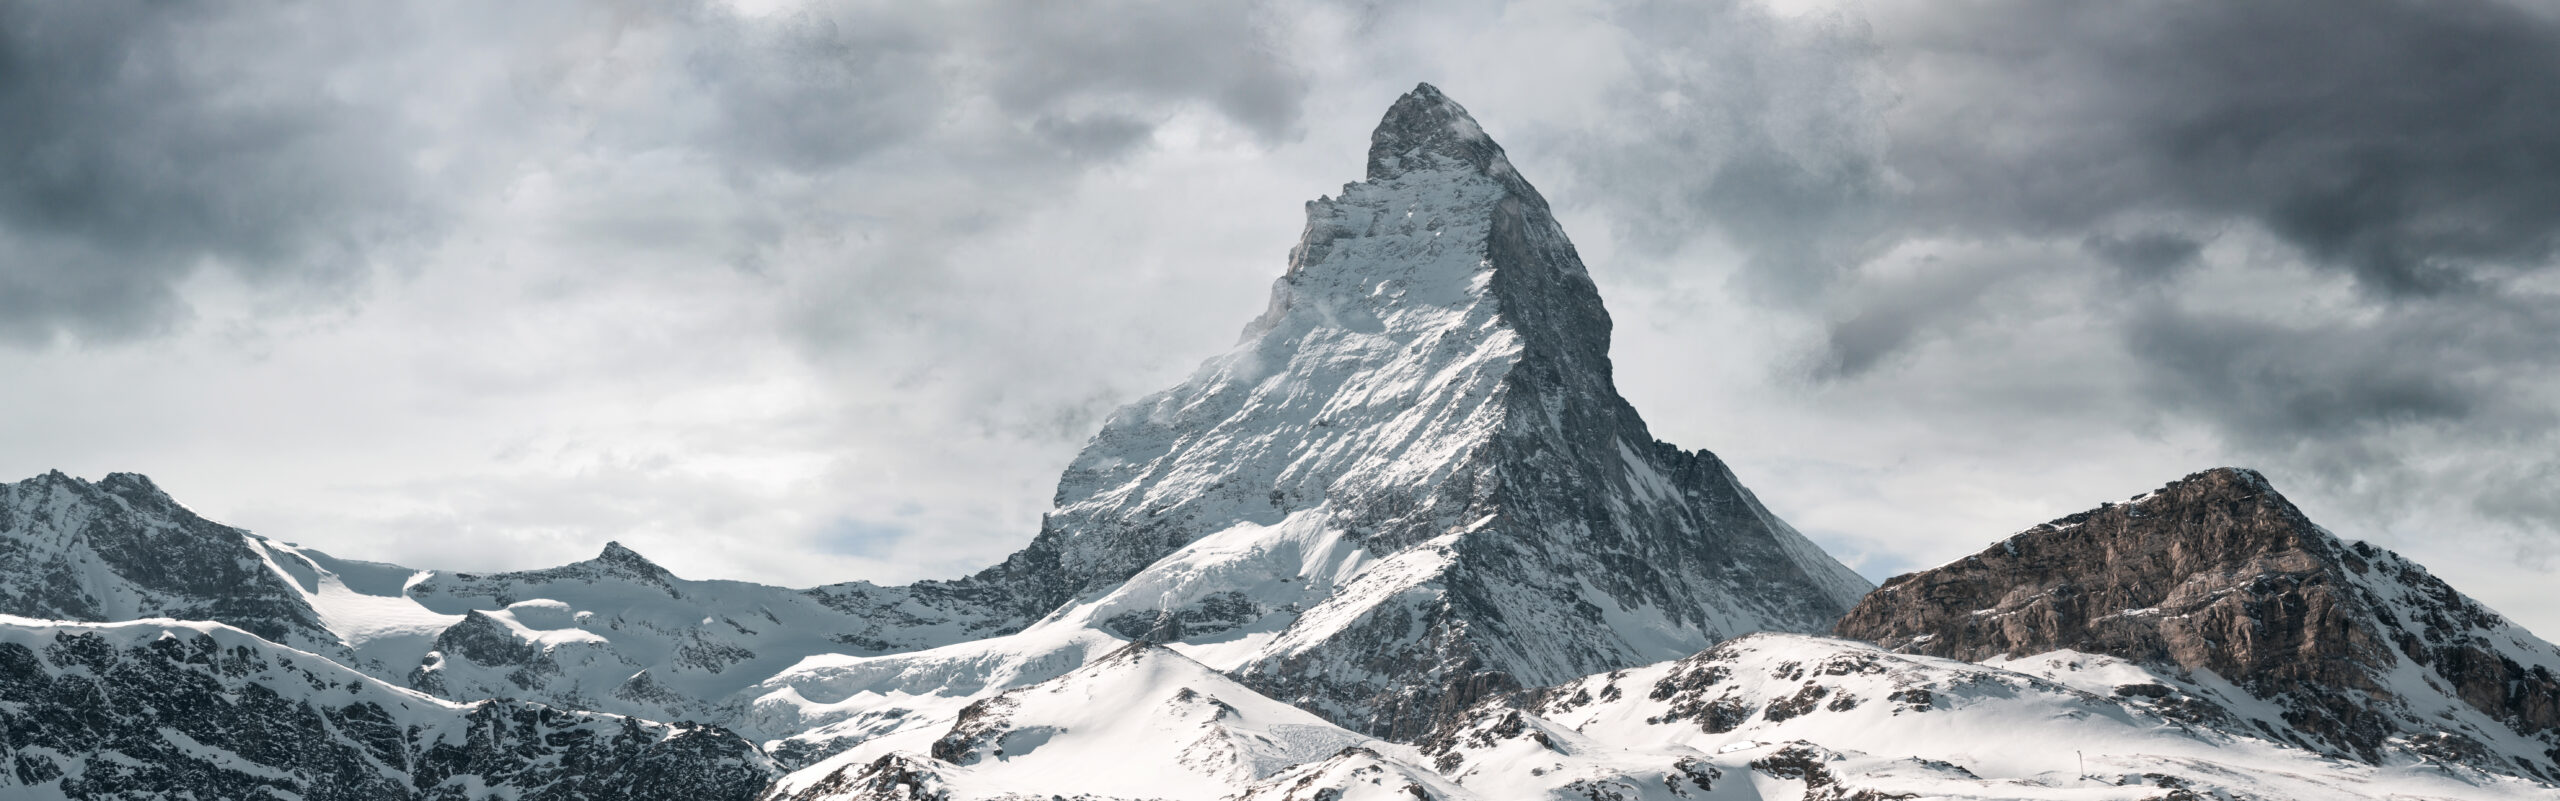
The Matterhorn proves that moderate technical moves can still create a high-consequence mountain.
Route-finding, speed, congestion, rockfall and descent fatigue can magnify a technically moderate route into a serious safety problem.
Continue the Research
This page owns the ranking question. The parent hub, peak pages and difficulty pages own the deeper analysis.
Death Rates by Mountain
Full historical/current comparison, metric definitions, causes and methodology.
Compare all death rates → Current ratio leaderAnnapurna Death Rate
75 deaths / 559 ascents = 13.42%, with the historic ~32% figure separated.
Open Annapurna data → Danger + difficultyK2 Death Rate
92 deaths / 964 summits = 9.54% in the closed-through-2025 GSG dataset.
Open K2 data → Alpine fatality historyMatterhorn Death Rate
Understand the large cumulative toll and why denominator choice matters in the Alps.
Open Matterhorn data → Traffic vs ratioEverest Death Rate
Separate absolute deaths from the much larger Everest summit denominator.
Open Everest data → Separate intent10 Hardest Mountains
Technical and overall climbing difficulty—not fatality ranking.
Compare difficulty → Outcome researchSummit Success Rates
Keep success probability and fatality ratios as distinct metrics.
Compare success → MethodologyMountaineering Truth Project
How Global Summit Guide handles conflicting, incomplete and changing mountain data.
Read methodology →Go Deeper on Outcomes & Uncertain Risk
These pages answer adjacent questions without taking over the core “most dangerous mountains” intent.
Annapurna Summit Success Rate
Annapurna leads this page’s newer published ratio discussion. The success-rate page answers the separate question: how often do climbers actually reach the summit?
Open Annapurna Summit Success →Cerro Torre Death Rate
Cerro Torre is the ideal example of obvious technical danger without a defensible all-history percentage denominator.
Read Cerro Torre Risk Analysis →Most Dangerous Mountains FAQ
Current ratios, historical reputation and total deaths are kept separate in every answer.
What is the most dangerous mountain in the world?
If dangerous means the highest newer published death-to-ascent ratio among the major Nepal Himalayan 8,000ers, Annapurna I leads at 13.42% in the current Guinness World Records comparison. If dangerous means the strongest combination of technical difficulty and severe objective hazard, K2 is the stronger answer.
Is Annapurna still the deadliest mountain?
Guinness World Records currently identifies Annapurna I as the deadliest Himalayan mountain in its Nepal-Himalaya comparison, at 13.42%. Dhaulagiri is nearly tied at 13.01%. Annapurna’s older ~27–32% figures are historical rather than the best current published comparison.
Is K2 more dangerous than Annapurna?
It depends on the metric. Annapurna has the higher newer published ratio in the cited Nepal-Himalaya comparison, while K2 combines a 9.54% GSG closed-through-2025 death-to-summit ratio with more sustained technical climbing, the Bottleneck serac, severe weather and a committing descent.
Why is Dhaulagiri ranked so high?
The current Guinness/Himalayan Database comparison lists Dhaulagiri at 92 deaths from 707 ascents, or 13.01%, only 0.41 percentage points below Annapurna’s 13.42%.
Does a 13% death rate mean 13% of climbers die?
No. On this page, published figures are deaths divided by recorded ascents or successful summits. They are not based on every climber who attempted the mountain and therefore are not personal probabilities.
Which mountain has killed the most people?
That is an absolute-toll question rather than a fatality-ratio question. Mont Blanc is frequently cited as having the largest broad historical climbing death toll because of centuries of climbing and huge participation, although exact all-history counts are uncertain. Everest has the largest absolute toll among the 8,000ers in the current Guinness comparison.
Is the deadliest mountain also the hardest?
No. Technical difficulty and fatality evidence are separate metrics. K2 ranks very high on both. Annapurna’s danger is driven heavily by avalanche and serac exposure, while Cerro Torre is technically extreme but lacks a reliable all-history statistical denominator.
Why can’t every dangerous mountain be ranked by percentage?
A defensible percentage requires both a reliable fatality count and a reliable exposure denominator. Rarely climbed technical peaks often lack complete historical attempt and summit records, so a precise percentage would create false precision.
Are modern climbers safer than early expeditions?
Forecasting, equipment, communications, professional expedition support and rescue have improved outcomes on many mountains. Objective hazards such as seracs, avalanche terrain, rockfall and extreme altitude remain.
How Global Summit Guide Built This Ranking
The ranking is deliberately broader than a single death-rate table but narrower than the full parent data hub.
Ranking rules
- Use current same-source published ratios where available.
- Label historical shorthand as historical.
- Do not interpret deaths-to-summits or deaths-to-ascents as per-attempt probability.
- Include objective hazard, technical severity, retreat and rescue margin in the editorial Top 10.
- Keep absolute death toll separate from percentage ratios.
- Do not invent precise percentages for low-traffic peaks with weak denominators.
Core sources
- Guinness World Records — Deadliest Himalayan Mountain
- The Himalayan Database
- Global Summit Guide K2 Death Rate for the separate closed-through-2025 K2 calculation.
- Death Rates by Mountain for the parent statistical framework.
Confidence: high in the current published Nepal-Himalaya ratios and K2 closed-dataset calculation; medium in any universal cross-range “Top 10” because source systems and definitions are not perfectly standardized.
Ownership boundary
This page answers “What are the most dangerous mountains in the world?” It should not duplicate the complete all-mountain table from Death Rates by Mountain, every peak-specific fatality page, or the technical rankings from 10 Hardest Mountains.
Annapurna Leads the Newer Published Ratio. K2 Best Combines Danger & Difficulty.
Use this ranking to understand the type of danger each mountain creates, then move into the parent death-rate hub and peak-specific pages for exact denominators, current context and planning implications.